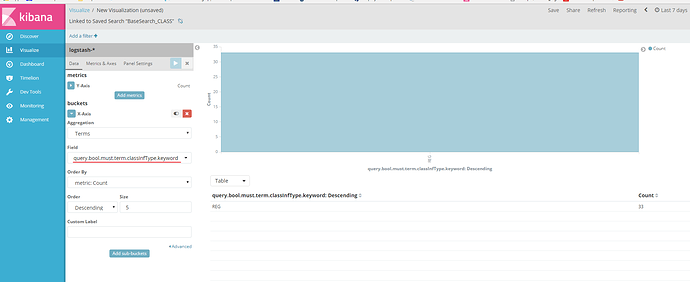
Hello, I want to create visualization for specific field 'dataType'. When a search is performed, this field can be in query as array (terms) or as a string (term). How can I combine these both in one visualization? For example, user searches for 'pdf' or 'word' (terms), then field will be query.bool.must terms.dataType.keyword. User searches for 'pdf' only, then field in vizualization will be query.bool.must term.dataType.keyword. I want to combine these two, so that in the pie chart I will have pdf : 2 , word : 1. Thank you very much.
Hello Brandon,
Thank you very much for your response. This is the situation: I have these two visualizations. I want to group them in one visualization, that will show 34 REG, 2 STAT, 3 RULING. I don't know how to do that.
'classInfType' is a metadata field in documents, and user can use it to refine the search results. I want to make a report for the most popular entries user has used, so I need to combine these two visualizations to get the final result.
Thanks.
Best regards,
Radostina
Gotcha, so you'd like to do a terms aggregation on the values from multiple fields. Elasticsearch supports two methods of doing so: https://www.elastic.co/guide/en/elasticsearch/reference/current/search-aggregations-bucket-terms-aggregation.html#_multi_field_terms_aggregation
You can create a Kibana scripted field that correlates to the "Script" option in the aforementioned Elasticsearch documentation, or you can derive a second column using the copy_to in the mapping (which will be faster to query).
This topic was automatically closed 28 days after the last reply. New replies are no longer allowed.


