Hello
I want to configure APM for Spring Web MVC with Tomcat and Jetty. The build generates a .WAR file. The current approach needs APM agent to be attached with standalone application with .JAR.
Please suggest.
Thanks
Hello
I want to configure APM for Spring Web MVC with Tomcat and Jetty. The build generates a .WAR file. The current approach needs APM agent to be attached with standalone application with .JAR.
Please suggest.
Thanks
I am trying to create the setenv.bat as I am working on windows. The below command is giving error.
export CATALINA_OPTS="$CATALINA_OPTS -javaagent:/path/to/elastic-apm-agent-<version>.jar"
Please suggest the change in case of .bat file.
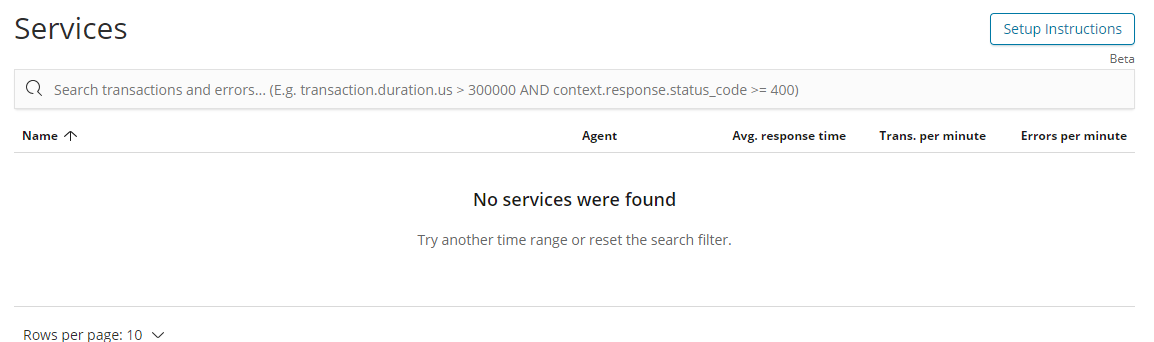
I have configured the tomcat as suggested in the documentation, tomcat is successfully started, but still Kibana is not showing the service. I have deployed an Spring Boot application which is working as per expectation.
Below is the content of the setenv.bat file
set CATALINA_OPTS=%CATALINA_OPTS% -javaagent:"C:/apache-tomcat-7.0.82/bin/elastic-apm-agent-0.6.2.jar"
Kibana shows : No services were found
Apache startup log shows :
C:\apache-tomcat-7.0.82\bin>rem Get standard environment variables
C:\apache-tomcat-7.0.82\bin>if not exist "C:\apache-tomcat-7.0.82\bin\setenv.bat" goto checkSetenvHome
C:\apache-tomcat-7.0.82\bin>call "C:\apache-tomcat-7.0.82\bin\setenv.bat"
C:\apache-tomcat-7.0.82\bin>set CATALINA_OPTS= -javaagent:"C:/apache-tomcat-7.0.82/bin/elastic-apm-agent-0.6.2.jar"
C:\apache-tomcat-7.0.82\bin>goto setenvDone
Hi,
I'm not a Java agent expert, but it might be because of the quotes in the "set" command? With the Windows/batch set command, double quotes get stored unless they surround the whole k=v, like "k=v".
Try changing
set CATALINA_OPTS=%CATALINA_OPTS% -javaagent:"C:/apache-tomcat-7.0.82/bin/elastic-apm-agent-0.6.2.jar"
to
set "CATALINA_OPTS=%CATALINA_OPTS% -javaagent:C:\apache-tomcat-7.0.82\bin\elastic-apm-agent-0.6.2.jar"
Sorry for the late reply.
Seems like the agent is already running in your application but it can't connect to the apm server. Are you running both locally?
Which version of the APM server are you using? If it's 6.4, you can go to http://localhost:8200/healthcheck to see if the server is up and running.
And sorry for the poor documentation on how to get started on windows.
Thanks a lot for replying. I checked the URL but I am getting a blank screen. Still Kibana status is No service found.
I am using Version 6.4 and I am running server and agent locally.
Hello Andrew
There is no change in behavior.
I'm a bit puzzled to be honest. Could you add the full agent and server logs, please?
True, even I am. I tried to make changes in the apm-server.yaml for the logging but the changes are not reflecting. In case of Agent how do i change the logging method and provide log file path.
Thanks a lot for your support.
How will the agent understand that it is tagged to a specific apm-server, as I do not see any facility configure the host IP in the agent.
Hi,
here are links to the logging configuration and server_url configuration options.
I hope that helps 
Logging I have done, but the same is not creating any log files.
Question: Where I have to configure server_url as i do not see any parameter in apm-server.yaml?
#================================ Logging ======================================
logging.level: debug
#logging.selectors: [ ]
#logging.to_syslog: true
logging.metrics.enabled: true
#logging.metrics.period: 30s
logging.to_files: true
#logging.files:
path: ["C://Program Files//APM-Server//logs"]
name: apm-server
#rotateeverybytes: 10485760 # = 10MB
#keepfiles: 20
#permissions: 0600
#logging.json: false
@Senz79 you can configure the host and port the APM Server is listening on with the setting apm-server.host at the very beginning of apm-server.yml.
Could you please run this query from Kibana DevTools and check what hits.total returns:
GET apm-*/_search
{
  "size": 0,
  "query": {
    "match_all": {}
  }
}
In case hits.total is not 0, data are ingested but it looks like you have to update the APM Server or Kibana config file, please see our Release Notes.
This is what is configured in apm host
apm-server:
host: "localhost:8300"
Below is the output of the query. The hits showing the number while is configured the agent to monitor a .JAR file around 2 week back. Currently I configure the agent in TOMCAT and that has 0 hits. Let me know how I can add date in the query or get the hits for today.
{
** "took": 7,**
** "timed_out": false,**
** "_shards": {**
** "total": 7,**
** "successful": 7,**
** "skipped": 0,**
** "failed": 0**
** },**
** "hits": {**
** "total": 26580,**
** "max_score": 0,**
** "hits": []**
** }**
}
Documents are indexed in a daily index by default. You can change the query from apm-*/_search to .e.g apm-*2018.09.03/_search for today's data.
@Senz79 you mentioned that the APM Server is listenting on port 8300, but your first post showed that the agent is trying to connect at port 8200. Please ensure to either have the agent configured to send data to your APM Server on port 8300 or change the APM Server config to listen on port 8200.
Could you attach the full apm-server logs as text, beginning from when you have started it?
C:\Program Files\APM-Server>apm-server.exe -e
2018-09-03T13:09:05.809+0530 INFO instance/beat.go:544 Home path: [C:\Program Files\APM-Server] Config path: [C:\Program Files\APM-Server] Data path: [C:\Program Files\APM-Server\data] Logs path: [C:\Program Files\APM-Server\logs]
2018-09-03T13:09:05.810+0530 INFO instance/beat.go:551 Beat UUID: 7c25ee4d-972b-4e0c-8312-5611157dec43
2018-09-03T13:09:05.810+0530 INFO [beat] instance/beat.go:768 Beat info {"system_info": {"beat": {"path": {"config": "C:\Program Files\APM-Server", "data": "C:\Program Files\APM-Server\data", "home": "C:\Program Files\APM-Server", "logs": "C:\Program Files\APM-Server\logs"}
, "type": "apm-server", "uuid": "7c25ee4d-972b-4e0c-8312-5611157dec43"}}}
2018-09-03T13:09:05.811+0530 INFO [beat] instance/beat.go:777 Build info {"system_info": {"build": {"commit": "59fbf0b6146ca5c50a94d1c435d0cf704e5b2a3f", "libbeat": "6.4.0", "time": "2018-08-17T22:12:40.000Z", "version": "6.4.0"}}}
2018-09-03T13:09:05.811+0530 INFO [beat] instance/beat.go:780 Go runtime info {"system_info": {"go": {"os":"windows","arch":"amd64","max_procs":4,"version":"go1.10.3"}}}
2018-09-03T13:09:05.972+0530 INFO [beat] instance/beat.go:784 Host info {"system_info": {"host": {"architecture":"x86_64","boot_time":"2018-09-03T09:27:43.16+05:30","hostname":"XXXXXXXX","ips":["xxxxxxxxxx:435f/64","xxxxxxxxxx/16","fe80::xxxxxxxx/64","xxxxxxxxx/16","fe80::xxxxxxxx/64","xxxxxxxx/16",
"fe80::xxxxxxxxxx/64","xxxxxxxxx/16","fe80::xxxxxxxx/64","xxxxxxxx/21","fe80::xxxxxxxxx/64","xxxxxxxx/16",
"fe80::a074:xxxxxx/64","xxxxxxxxx/24","::1/128","127.0.0.1/8","fe80::5e
fe:cxxxxxx/128","fe80::e0:0:0:0/64","fe80xxxxxxx/128"],"kernel_version":"6.1.7601.24214 (win7sp1_ldr_escrow.180801-1700)",
"mac_addresses":["00:xxxxxxxxx","xxxxxxxx","xxxxxx","4a:45:20:bf:41:f5","xxxxxx","xxxxxxx","0a:00:27:00:00:2a","00:00:00:0
0:00:00:00:e0","00:00:00:00:00:00:00:e0","00:00:00:00:00:00:00:e0","00:00:00:00:00:00:00:e0","00:00:00:00:00:00:00:e0"],
"os":{"family":"windows","platform":"windows","name":"Windows 7 Enterprise","version":"6.1","major":1,"minor":0,"patch":0,"build":"7601.24214"}
,"timezone":"IST","timezone_offset_se
c":19800,"id":"426f3f3e-fbc0-41b1-8f1f-299e3eeaceb0"}}}
2018-09-03T13:09:05.973+0530 INFO instance/beat.go:273 Setup Beat: apm-server; Version: 6.4.0
2018-09-03T13:09:05.973+0530 INFO elasticsearch/client.go:163 Elasticsearch url: http://localhost:9200
2018-09-03T13:09:05.974+0530 INFO pipeline/module.go:98 Beat name: XXXXXXXX
2018-09-03T13:09:05.974+0530 INFO instance/beat.go:367 apm-server start running.
2018-09-03T13:09:05.974+0530 INFO [monitoring] log/log.go:114 Starting metrics logging every 30s
2018-09-03T13:09:05.974+0530 INFO [beater] beater/beater.go:172 self instrumentation is disabled
2018-09-03T13:09:05.980+0530 INFO [beater] beater/beater.go:113 host resolved from localhost:8200 to 127.0.0.1:8200
© 2020. All Rights Reserved - Elasticsearch
Apache, Apache Lucene, Apache Hadoop, Hadoop, HDFS and the yellow elephant logo are trademarks of the Apache Software Foundation in the United States and/or other countries.