Kibana version: 6.7.0
Elasticsearch version: 6.7.0
Original install method (e.g. download page, yum, from source, etc.): docker
Information about experience and what I am trying to achive (Controls and Vega-Lite): I want to visualize time series and when there is anomaly to mark with red and when there is no anomaly to mark it with green or not mark it at all. I tried many different visualization with kibana but I did not manage to get a visualization that does the job so I turned to vega-lite. Vega-lite is an excelent visualization tool but I want to make it more interactive. I managed to make a simple visualization with dummy data in vega-lite but when let's say the user only wants to see one or two types of logs the proper way is to set it trough some control and to visualize only those logs. The only solution that I managed to find is to change the code (which will not work in production).
Description of the problem including expected versus actual behavior (Controls and Vega-Lite!) :
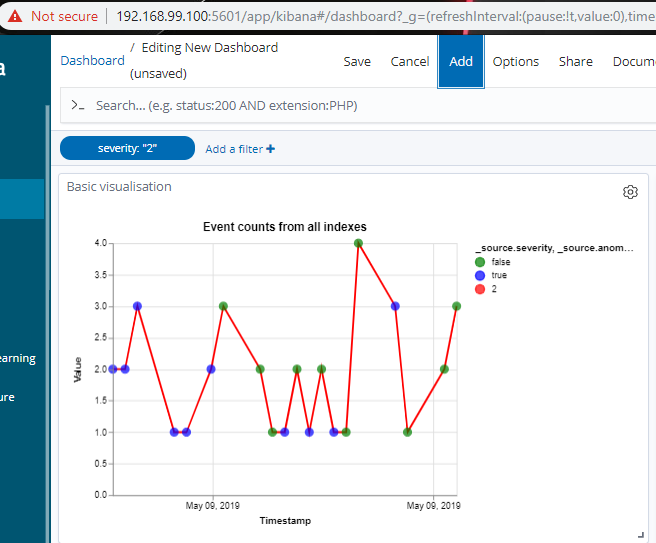
EXPECTED ONLY WORKS BECAUSE I CHANGED THE CODE TO GIVE ONLY LOG2
-Applying a filter trough controls and showing only those line that are specified (expected)

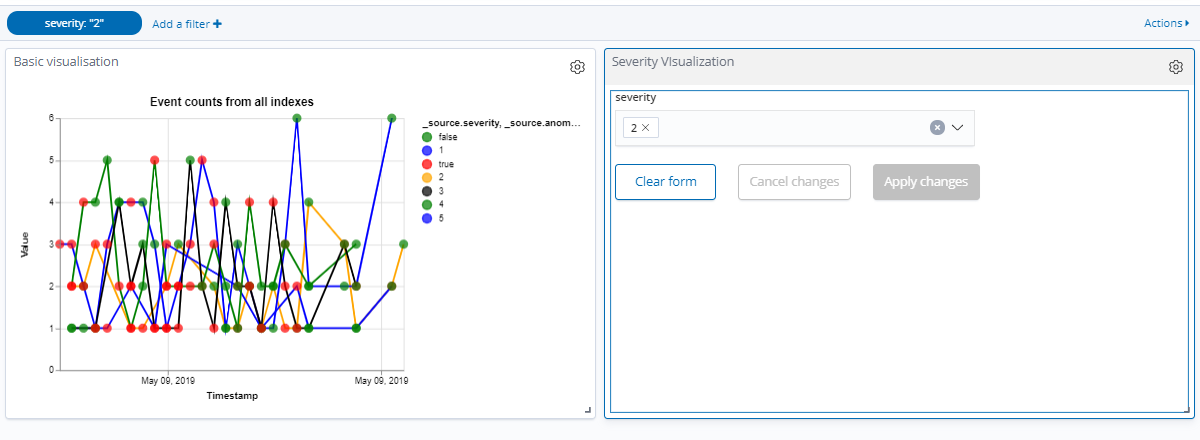
-Nothing changes from the graph is the same as before (actual)
**The code that I am using with Vega-Lite **
{
  $schema: https://vega.github.io/schema/vega-lite/v2.json
  title: Event counts from all indexes
  data: {
    url: {
      index: log*
      body: {
      size: 100
      sort : [
        { "timestamp" : {"order" : "desc"}},
      ],
        query: {
          range: {
            timestamp: {gte: "now-110h/d", lte: "now"}
          }
        }
      }
    }
    format: {property: "hits.hits"}
  }
  layer: [
    {
      mark: {type: "line"}
      encoding: {
        x: {field: "_source.timestamp", type: "temporal",
        "axis": {"title": "Timestamp"}}
        y: {field: "_source.count", type: "quantitative"
        "axis": {"title": "Value"}}
        color: {field: "_source.severity", type: "nominal", "scale": {"range": ["green", "blue", "red","orange","black"]}}
      }
    }
    // {
    //   mark: {type: "point"}
    //   encoding: {
    //     x: {field: "_source.timestamp", type: "temporal", "timeUnit": "yearmonthdatehoursminutes"}
    //     y: {field: "_source.value", type: "quantitative"}
    //     color: {field: "symbol", type: "nominal"}
    //   }
    // }
    {
      mark: {type: "circle" size: "100"}
      encoding: {
        x: {field: "_source.timestamp", type: "temporal"}
        y: {field: "_source.count", type: "quantitative"}
        color: {field: "_source.anomaly", type: "nominal", "scale": {"range": ["green", "blue", "red"]}}
      }
      "hover": {
              "fillOpacity": {"value": 0.5}
            }
    }
  ]
}
Information about experience and what I am trying to achive (Interactive Vega-Lite) :
Well on the vega-lite examples when you hover over a value a small window appears that show you the information that that dot has, while when you do the same in kibana that window never opens. I was wondering can I somehow enable this in kibana
Description of the problem including expected versus actual behavior (Interactive Vega-Lite):
-When you hover the window appears like in the image (Expected screenshot from vega-lite examples

-Nothing appears in kibana (screenshot from kibana)