Coordinating Nodes High Circuit Breaker Tripped Counts

Hi All,

I'm curious if anyone has any ideas on an issue I'm seeing.

I have a cluster of 33 nodes, 3 of these nodes are coordinating only nodes that handle all requests.

I've been noticing that these coordinating nodes have an extremely high parent circuit breaker tripped count.

    "uUIbozFjSMOm1CKZlB5Atg": {
      "name": "es-prod-es-rack1-coord-0",
      "breakers": {
        "parent": {
          "tripped": 119819
        }
      }
    },
    "ATktQgbSTSWWuV1oJpJnRg": {
      "name": "es-prod-es-rack2-coord-0",
      "breakers": {
        "parent": {
          "tripped": 49858
        }
      }
    },
    "aMKjx9cSSbe67xzTOv8wVw": {
      "name": "es-prod-es-rack5-coord-0",
      "breakers": {
        "parent": {
          "tripped": 41976
        }
      }
    },

For reference of the other 30 nodes in the cluster only 2 other nodes have more than 0 trips and they're both relatively low:

    "ewLOLe_LTxe-MWS3REVtNQ": {
      "name": "es-prod-es-rack5-data-hot-0",
      "breakers": {
        "parent": {
          "tripped": 8465
        }
      }
    },
    "NKuwIgtERMe_1KaLBTAGUQ": {
      "name": "es-prod-es-rack2-data-warm-0",
      "breakers": {
        "parent": {
          "tripped": 259
        }
      }
    },

The coordinating only nodes have the following specs:

  • Min: 10 "CPU", Max: 14 "CPU"
  • Memory: 24Gi
  • Heap: 22g
ES_JAVA_OPTS: -Xms22g -Xmx22g

The entire cluster is on 8.9.2.

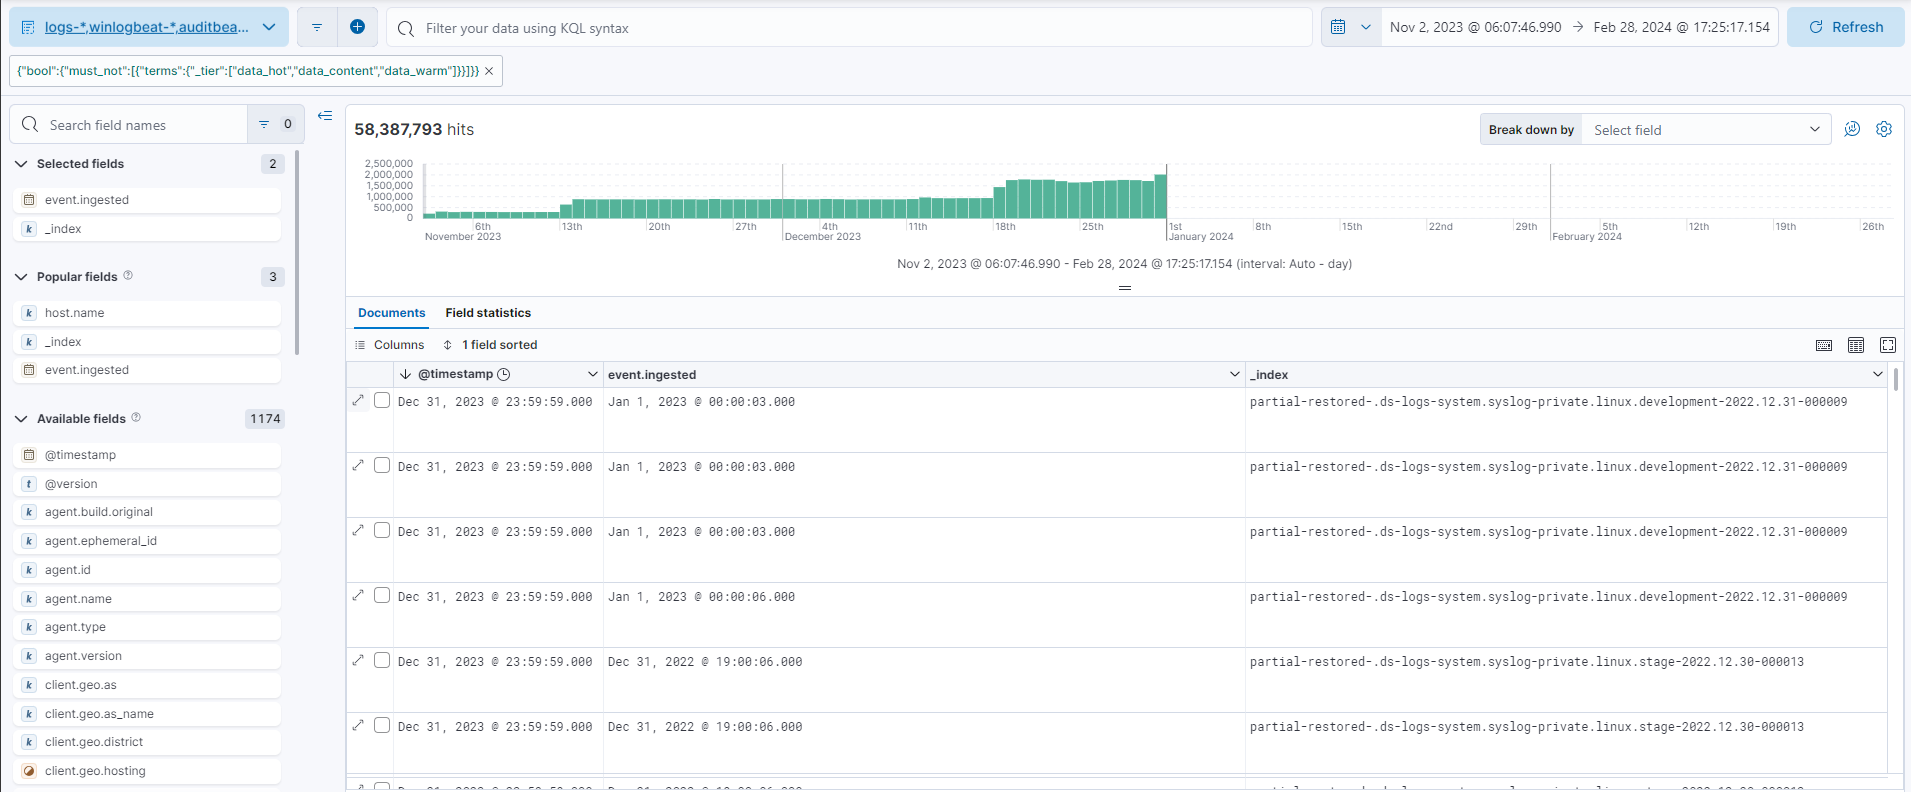
The cluster processes ~35k e/s (70 e/s including replicas), and handles ~1k search/s (lows) - 7k search/s (peaks).

Most of the events are from Elastic Agents, and most of the searches are from Kibana rules (Observability/Security).

Looking at the monitoring of the Coordinating nodes, I see heap is generally around 13-14G with peaks ~18-19G.

I'm curious if anyone has any ideas on dealing with these circuit breakers. I did read Circuit breaker errors | Elasticsearch Guide [8.10] | Elastic & Circuit breaker settings | Elasticsearch Guide [8.10] | Elastic, but there isn't clear guidance on how to track down what the main "consumers" of parent are.

I did also take a look at the 8.10.x release notes to see if there were any things that might show an improvement here.

Note: I'm posting this because it almost feels like a bug/regression from the last few releases ?~8.7.x? (I don't have proof that this is a regression, but I think I see the circuit breaker more now, and the cluster load hasn't changed much).

Sounds similar to this issue: 8.7.1 was the first version bundled with JDK20 which changed some GC behaviour over JDK19 that apparently doesn't work so well with ES's allocation pattern. JDK21 is out now and apparently behaves better, so it'd be worth upgrading when we release a version compatible with (and bundled with) JDK21.

1 Like

Thanks @DavidTurner! It looks like 8.10.3 is currently slated to get JDK 21, provided that comes out before 8.11, I'll look to upgrade to it to confirm a difference of behavior.

That's right, although nothing is certain until it's released.

My understanding of the problem is fairly limited, but it seems particularly problematic with so-called humongous allocations, which is something that coordinating nodes will do if handling large (say ≥1MiB) documents in search results. Does that fit your usage pattern?

but it seems particularly problematic with so-called humongous allocations, which is something that coordinating nodes will do if handling large (say ≥1MiB) documents in search results. Does that fit your usage pattern?

I'm honestly not 100% sure here on doc sizes, this cluster mainly uses Elastic Stack product events (metrics/logs/synthetics - Kibana observability & security, and Elasticsearch anomaly, Fleet/Elastic Agent) so I haven't familiarized myself too much with these types of details.

I do know that this cluster does handle Elastic Synthetics which do contain encoded/stored screenshots, I'm not sure how large these actually are though.

I also know that while it doesn't deal as much with large documents it does deal with exceptionally high cardinality EQL queries that can often take a while (30 sec - 2 min) to run, not sure if this is potentially another type of pattern that could cause the issue.

Circling back around to this issue. I was able to upgrade to 8.10.4 a bit ago, but unfortunately that didn't seem to resolve the issue that much.

After additional investigation, I believe I tracked down the issue to a number of extremely inefficient Elastic SIEM/Detection Rules/EQL that Elastic is shipping. About ~10 rules were consistently timing out at the 2 minute mark, and after disabling these the circuit breaking exceptions dropped significantly. They still happen occasionally, but I suspect that there are still a good chunk of SIEM rules are can be significantly optimized even if they aren't timing out.

I've opened some tickets to at least get some discussions started on optimizing some of the rules:

I also did open a feature request on Elasticsearch as I think some of these rules' inefficiencies are partially because of a missing feature:

Though one thing I was never really able to find a good way of measuring was "how much Heap" a query was actively consuming. I'm not sure if there is really a good way to determine this type of information though.

Thanks for the additional info and creating those issues @BenB196 ! Could you post the list of other rules that were timing out here as well so we can review those?

The issues you created look great, we really appreciate the detail and suggestions.

We have seen a number of performance issues in the past with SIEM rules that query frozen tier indices, especially when some documents in those indices have timestamps in the future. Future timestamps can come from hosts with incorrect clocks and often prevent Elasticsearch from making important optimizations based on the query time range. The slow search symptoms you've described here may not be due to frozen tier indices/future timestamps, but it's worth checking if there are cold/frozen tier nodes in your cluster that have future timestamps as that could definitely slow things down.

Hi @Marshall_Main :wave:

Sure, here is my current list of rules which consistently time out:

There are two consistent themes across these rules (and many other "poorly performing rules")

  1. Avoidance of using *.text fields, where they could provide significant performance improvements.
    • I think that this issue highlights this.
  2. An inability to properly order EQL sequences for efficiency (EQL enhancement linked above)
1 Like

To answer your second question:

We have seen a number of performance issues in the past with SIEM rules that query frozen tier indices, especially when some documents in those indices have timestamps in the future. Future timestamps can come from hosts with incorrect clocks and often prevent Elasticsearch from making important optimizations based on the query time range. The slow search symptoms you've described here may not be due to frozen tier indices/future timestamps, but it's worth checking if there are cold/frozen tier nodes in your cluster that have future timestamps as that could definitely slow things down.

Yes, we had a few systems at the beginning of this year have an off-by 1-year issue;

^ Event ingested 01/01/2023, but index for 12/31/2023.

This in theory should clear up future events at the end of this year (2023).

I can see this contributing somewhat to slow events in some cases, but I still think part of this comes down to rule optimization.

Thanks again for the additional information! We'll take a look at those potential optimizations. I think the sample approach for Account Password Reset Remotely looks promising. In [Rule Tuning] Potential Privilege Escalation via PKEXEC, the original EQL query is treating the * characters as wildcards whereas the modified proposal to use match on file.path.text treats * as a literal * which may account for a portion of the performance difference but also changes the result set. I don't know if the changes to the result set would be a problem - the rule author team would know better and will engage on the Github issue.

Yes, we had a few systems at the beginning of this year have an off-by 1-year issue;

If you duplicate these rules that consistently time out and edit the duplicates by selecting the Do not use @timestamp as a fallback timestamp field option, that may significantly improve the performance when there are future timestamps in frozen tier indices. (In section I, "Timestamp override" docs).

Without that option selected, the rule will query for documents where either the timestamp override (event.ingested) is in the time range OR event.ingested doesn't exist and @timestamp is in the time range. With that option selected, the rule will instead query only documents where event.ingested is in the time range. Elasticsearch will avoid sending the full query to shards that can not possibly match the query, and one way it does this is by keeping track of the range of timestamps in each index. When some values of @timestamp are in the future, the query that only looks at event.ingested can skip the old frozen indices entirely whereas the query that looks at both event.ingested and @timestamp must do much more work.

Also, we're actively working on making it easier to customize these prebuilt rules without having to duplicate them first.

Thanks again for the additional information! We'll take a look at those potential optimizations. I think the sample approach for Account Password Reset Remotely looks promising. In [Rule Tuning] Potential Privilege Escalation via PKEXEC, the original EQL query is treating the * characters as wildcards whereas the modified proposal to use match on file.path.text treats * as a literal * which may account for a portion of the performance difference but also changes the result set. I don't know if the changes to the result set would be a problem - the rule author team would know better and will engage on the Github issue.

Thanks for calling this out, I had completely missed testing leading/trailing characters are part of the suggestion. I've replied to that issue with some additional context for the rule authors.

If you duplicate these rules that consistently time out and edit the duplicates by selecting the Do not use @timestamp as a fallback timestamp field option, that may significantly improve the performance when there are future timestamps in frozen tier indices. (In section I, "Timestamp override" docs).

I went ahead and tested this out on, Abnormal Process ID or Lock File Created and Cron Job Created or Changed by Previously Unknown Process, and these now seem to complete in ~20-30 seconds rather than timing out after 2 minutes, which is definitely better.

Somewhat of a related question, has it been considered to just exclude the cold/frozen tiers from detection rules? I tested this method on one of the rules as well:

And got similar performance to disabling fallback, but with advantage of keeping fallback enabled.

Also, we're actively working on making it easier to customize these prebuilt rules without having to duplicate them first.

This sounds nice, not having to duplicate rules to make minor adjustments would make things significantly easier to maintain in some areas.

We have an open issue to explore the idea, but it hasn't been prioritized in part because disabling timestamp fallback provides a very similar capability to fix the most common frozen data performance issues we see, where future timestamps in frozen data prevent Elasticsearch from optimizing the query to avoid hitting frozen indices based on the time range filter alone. If your data sources are all populating event.ingested then there shouldn't be any downside to disabling fallback - the fallback is really only needed if some sources don't have the right ingest pipelines set up to populate event.ingested. That said, I do see how an option to explicitly exclude frozen data could be valuable as a more obvious method to improve performance when queries are performing poorly.

I added a link to this thread to the issue so we can keep track of it and take this use case into account when we're reviewing issues and prioritizing.

1 Like

This topic was automatically closed 28 days after the last reply. New replies are no longer allowed.