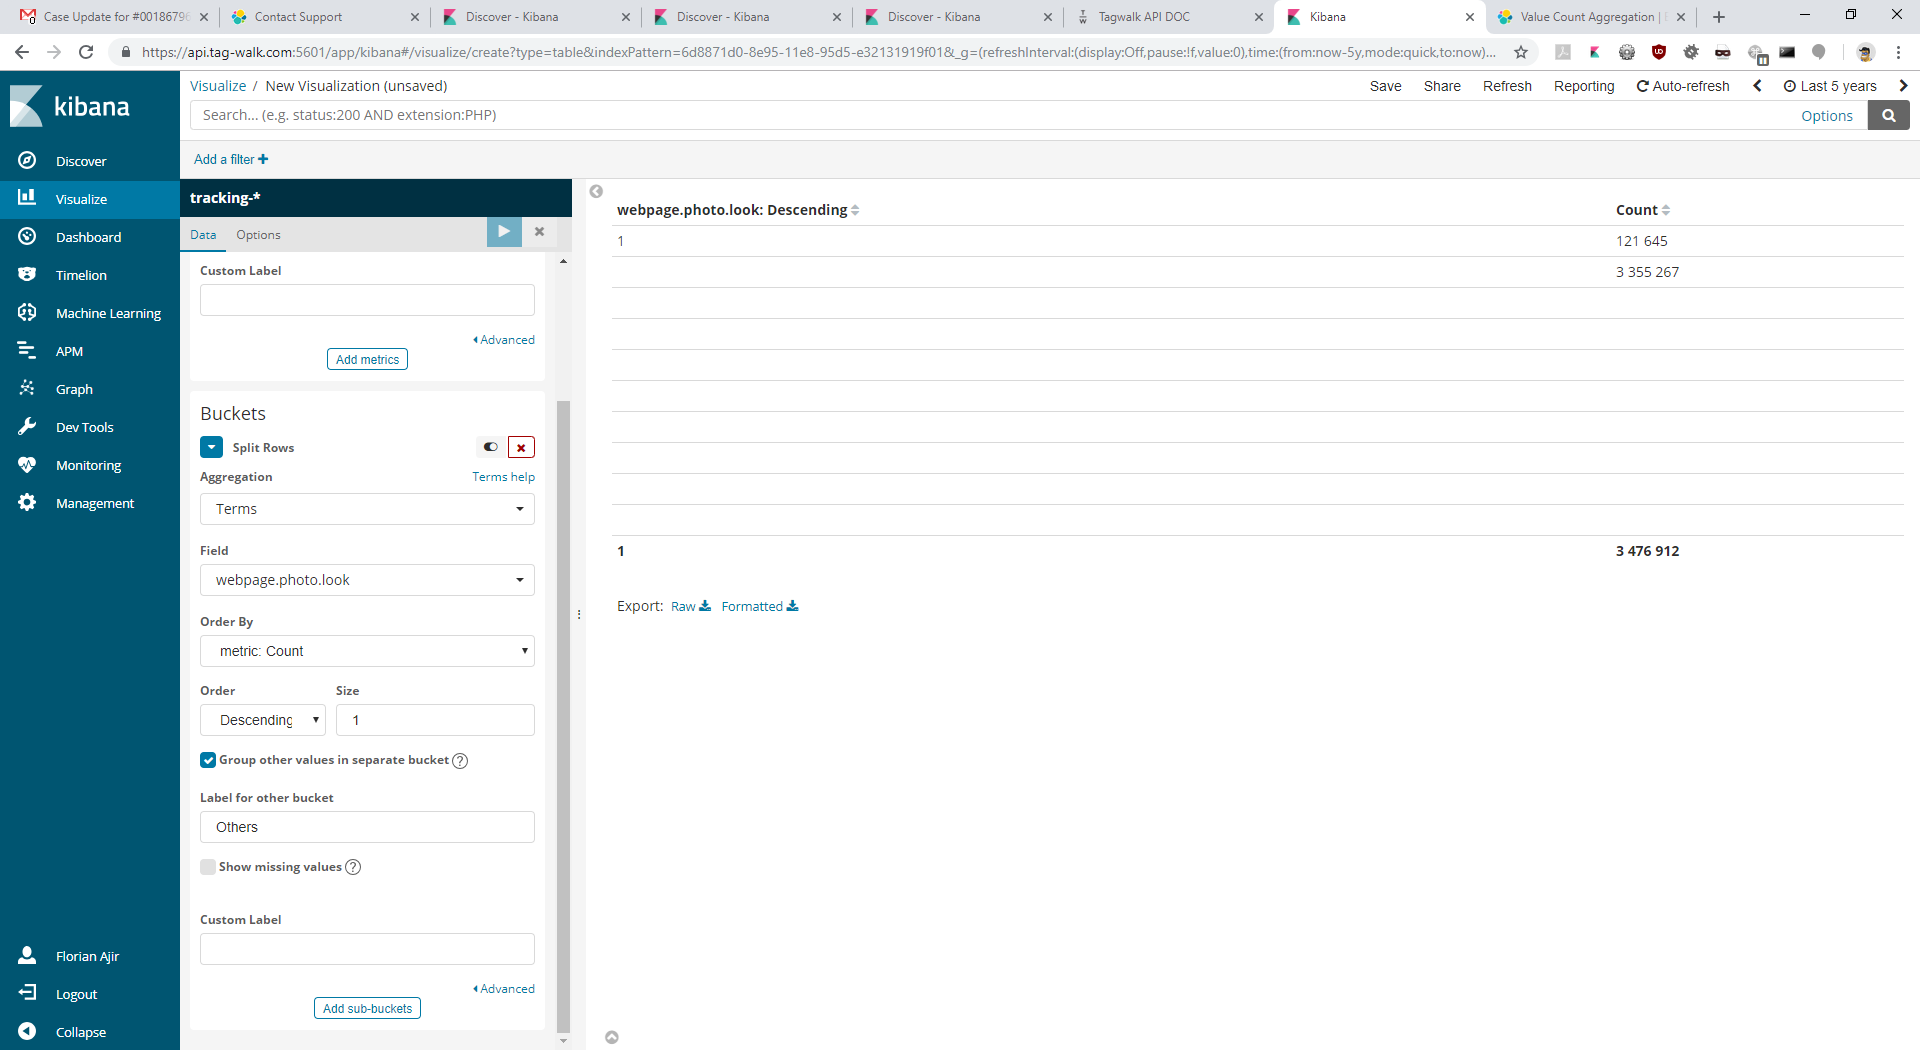
I created a data table visualization on a big sized elasticsearch wildcard index from logstash, with count metric aggregation, split rows by term order descending.
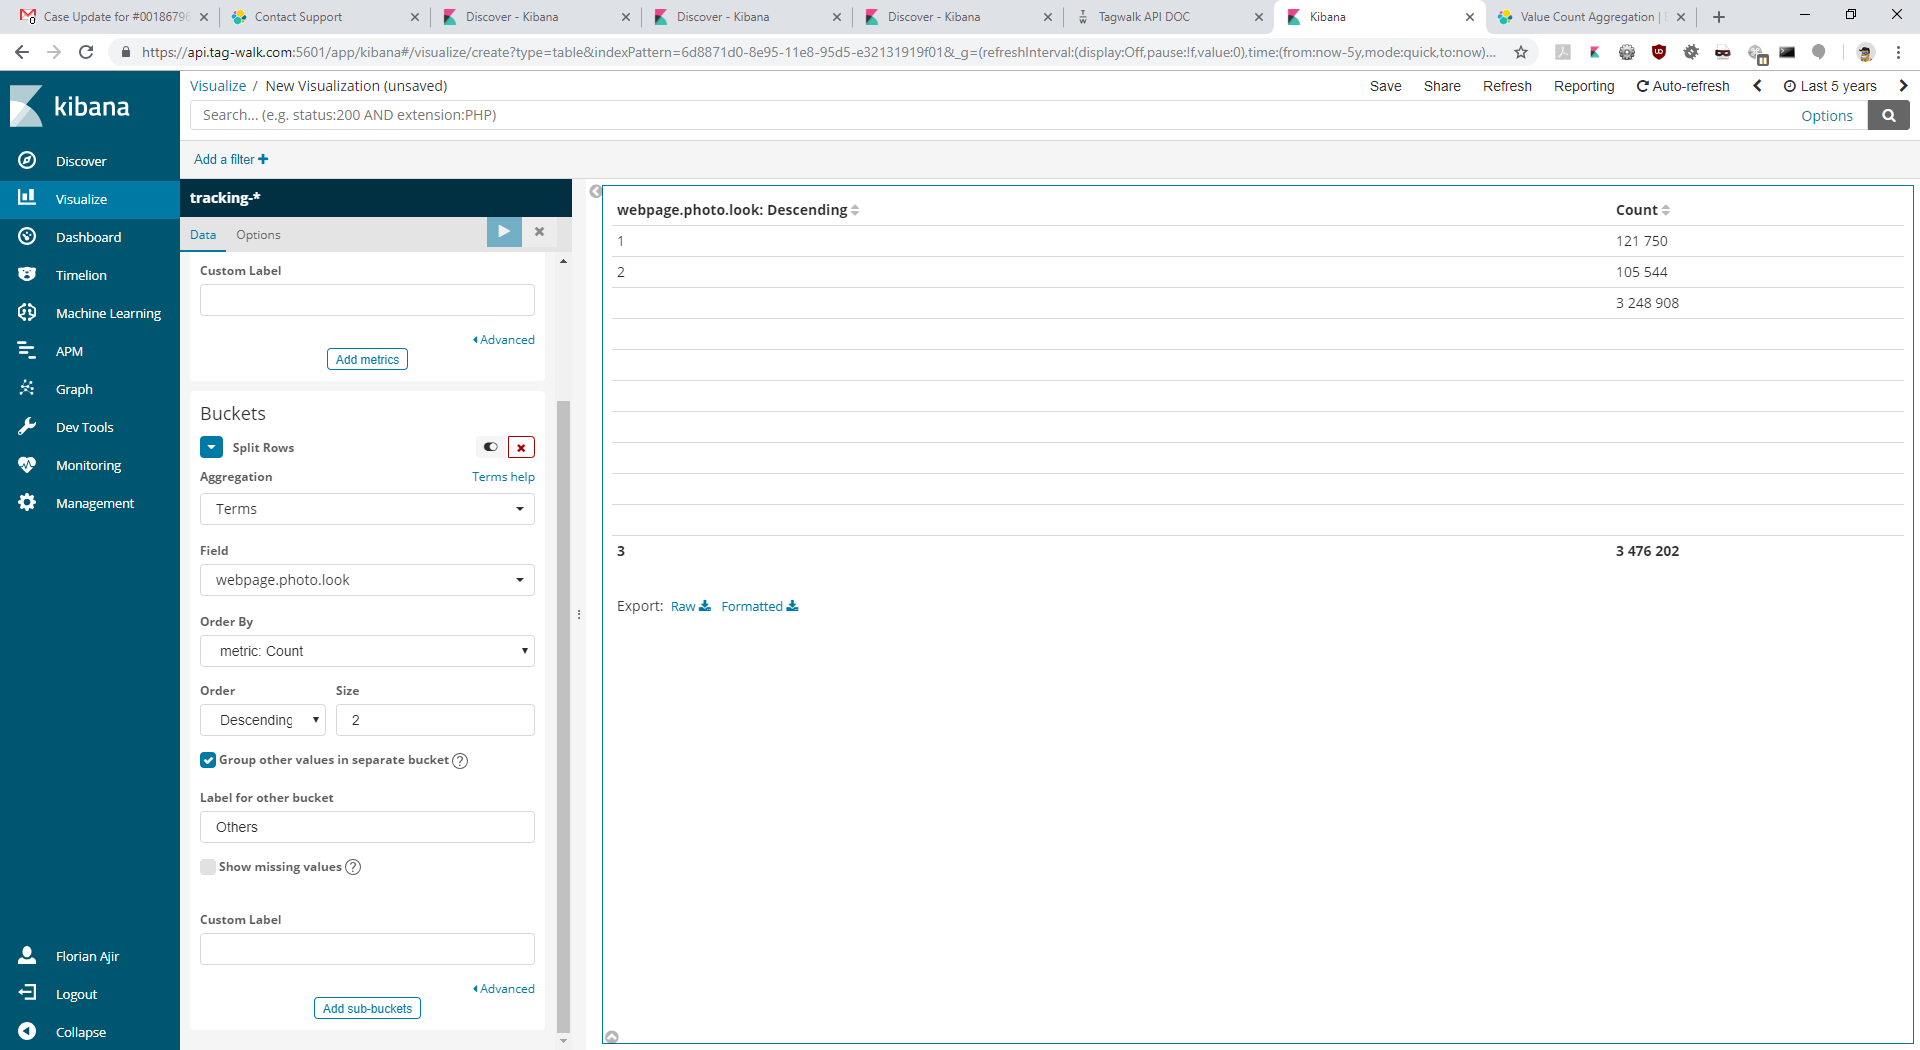
When I try different size in the split row section the count value change.
with size = 1, count = 121 645
with size = 2, count = 121 750
with size = 100, count = 122 162

This is also affecting the total even with group others values checked.
Anybody can give me an explanation of this strange behavior please ?