Hi,
I have used date histogram with 5m interval starting for the last 10 minutes as below:
There is no data before 17:36:45 in my index.
GET metricbeat-7.3.2/_search
{
  "size": 0,
  "query": {
    "bool": {
      "filter": {
        "range": {
          "@timestamp": {
            "gte": "2019-10-03T17:36:00.000Z",
            "lte": "2019-10-03T17:46:00.000Z"
          }
        }
      }
    }
  },
  "aggs": {
    "histo": {
      "date_histogram": {
        "field": "@timestamp",
        "interval": "5m"
        }
      }
    }
  }
This gives below aggregation output:
"aggregations" : {
    "histo" : {
      "buckets" : [
        {
          "key_as_string" : "2019-10-03T17:35:00.000Z",
          "key" : 1570124100000,
          "doc_count" : 267
        },
        {
          "key_as_string" : "2019-10-03T17:40:00.000Z",
          "key" : 1570124400000,
          "doc_count" : 488
        },
        {
          "key_as_string" : "2019-10-03T17:45:00.000Z",
          "key" : 1570124700000,
          "doc_count" : 70
        }
      ]
    }
  }
But after I make changes in query to fetch data from 17:36:55. I changed the seconds from 00 to 55.
GET metricbeat-7.3.2/_search
{
  "size": 0,
  "query": {
    "bool": {
      "filter": {
        "range": {
          "@timestamp": {
            "gte": "2019-10-03T17:36:55.000Z",
            "lte": "2019-10-03T17:46:55.000Z"
          }
        }
      }
    }
  },
  "aggs": {
    "histo": {
      "date_histogram": {
        "field": "@timestamp",
        "fixed_interval": "5m"
        }
      }
    }
  }
Then I get a different output as below
 "aggregations" : {
    "histo" : {
      "buckets" : [
        {
          "key_as_string" : "2019-10-03T17:35:00.000Z",
          "key" : 1570124100000,
          "doc_count" : 246
        },
        {
          "key_as_string" : "2019-10-03T17:40:00.000Z",
          "key" : 1570124400000,
          "doc_count" : 488
        },
        {
          "key_as_string" : "2019-10-03T17:45:00.000Z",
          "key" : 1570124700000,
          "doc_count" : 169
        }
      ]
    }
  }
From the above two output, in the first bucket there, document count changes from 267 to 246 because in the second query it starts from 17:36:55 so the second output doesn't take records from 17:36:00 to 17:36:54. Why is this behavior?
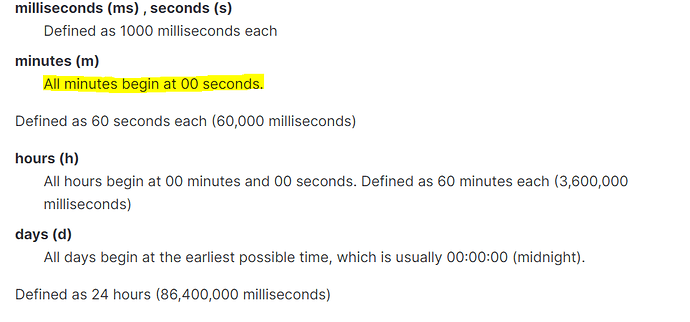
I can see from the document that for minute interval, it should start with 00 seconds.If I use this query in watcher then it doesn't take the required documents because of difference in seconds in every watcher execution.
