Hi the fit output from my cluster:
{
  "_nodes" : {
    "total" : 6,
    "successful" : 6,
    "failed" : 0
  },
  "cluster_name" : "elasticsearch",
  "cluster_uuid" : "-Js7ZjOCTliHzOAU8Ryw8Q",
  "timestamp" : 1711623428326,
  "status" : "green",
  "indices" : {
    "count" : 39,
    "shards" : {
      "total" : 86,
      "primaries" : 47,
      "replication" : 0.8297872340425532,
      "index" : {
        "shards" : {
          "min" : 2,
          "max" : 6,
          "avg" : 2.2051282051282053
        },
        "primaries" : {
          "min" : 1,
          "max" : 4,
          "avg" : 1.205128205128205
        },
        "replication" : {
          "min" : 0.0,
          "max" : 1.0,
          "avg" : 0.9487179487179487
        }
      }
    },
    "docs" : {
      "count" : 70533053,
      "deleted" : 16403283
    },
    "store" : {
      "size_in_bytes" : 309114997034,
      "total_data_set_size_in_bytes" : 309114997034,
      "reserved_in_bytes" : 0
    },
    "fielddata" : {
      "memory_size_in_bytes" : 718874832,
      "evictions" : 0
    },
    "query_cache" : {
      "memory_size_in_bytes" : 145833775,
      "total_count" : 15189882,
      "hit_count" : 589167,
      "miss_count" : 14600715,
      "cache_size" : 26773,
      "cache_count" : 58794,
      "evictions" : 32021
    },
    "completion" : {
      "size_in_bytes" : 0
    },
    "segments" : {
      "count" : 725,
      "memory_in_bytes" : 31433902,
      "terms_memory_in_bytes" : 17961104,
      "stored_fields_memory_in_bytes" : 627448,
      "term_vectors_memory_in_bytes" : 0,
      "norms_memory_in_bytes" : 2249152,
      "points_memory_in_bytes" : 0,
      "doc_values_memory_in_bytes" : 10596198,
      "index_writer_memory_in_bytes" : 997475518,
      "version_map_memory_in_bytes" : 5057814,
      "fixed_bit_set_memory_in_bytes" : 14510360,
      "max_unsafe_auto_id_timestamp" : 1711584004303,
      "file_sizes" : { }
    },
    "mappings" : {
      "field_types" : [
        {
          "name" : "alias",
          "count" : 186,
          "index_count" : 2,
          "script_count" : 0
        },
        {
          "name" : "boolean",
          "count" : 80,
          "index_count" : 18,
          "script_count" : 0
        },
        {
          "name" : "constant_keyword",
          "count" : 6,
          "index_count" : 2,
          "script_count" : 0
        },
        {
          "name" : "date",
          "count" : 185,
          "index_count" : 28,
          "script_count" : 0
        },
        {
          "name" : "flattened",
          "count" : 133,
          "index_count" : 5,
          "script_count" : 0
        },
        {
          "name" : "float",
          "count" : 78,
          "index_count" : 11,
          "script_count" : 0
        },
        {
          "name" : "geo_point",
          "count" : 16,
          "index_count" : 2,
          "script_count" : 0
        },
        {
          "name" : "half_float",
          "count" : 40,
          "index_count" : 10,
          "script_count" : 0
        },
        {
          "name" : "integer",
          "count" : 116,
          "index_count" : 7,
          "script_count" : 0
        },
        {
          "name" : "ip",
          "count" : 30,
          "index_count" : 4,
          "script_count" : 0
        },
        {
          "name" : "keyword",
          "count" : 2605,
          "index_count" : 28,
          "script_count" : 0
        },
        {
          "name" : "long",
          "count" : 1133,
          "index_count" : 20,
          "script_count" : 0
        },
        {
          "name" : "nested",
          "count" : 43,
          "index_count" : 14,
          "script_count" : 0
        },
        {
          "name" : "object",
          "count" : 1099,
          "index_count" : 24,
          "script_count" : 0
        },
        {
          "name" : "scaled_float",
          "count" : 122,
          "index_count" : 5,
          "script_count" : 0
        },
        {
          "name" : "text",
          "count" : 467,
          "index_count" : 23,
          "script_count" : 0
        },
        {
          "name" : "version",
          "count" : 4,
          "index_count" : 4,
          "script_count" : 0
        },
        {
          "name" : "wildcard",
          "count" : 3,
          "index_count" : 3,
          "script_count" : 0
        }
      ],
      "runtime_field_types" : [ ]
    },
    "analysis" : {
      "char_filter_types" : [
        {
          "name" : "pattern_replace",
          "count" : 3,
          "index_count" : 3
        }
      ],
      "tokenizer_types" : [ ],
      "filter_types" : [
        {
          "name" : "morfologik_stem",
          "count" : 3,
          "index_count" : 3
        },
        {
          "name" : "snowball",
          "count" : 24,
          "index_count" : 3
        },
        {
          "name" : "stemmer",
          "count" : 24,
          "index_count" : 3
        },
        {
          "name" : "stop",
          "count" : 54,
          "index_count" : 3
        },
        {
          "name" : "synonym",
          "count" : 9,
          "index_count" : 3
        }
      ],
      "analyzer_types" : [
        {
          "name" : "custom",
          "count" : 111,
          "index_count" : 3
        }
      ],
      "built_in_char_filters" : [ ],
      "built_in_tokenizers" : [
        {
          "name" : "keyword",
          "count" : 3,
          "index_count" : 3
        },
        {
          "name" : "whitespace",
          "count" : 108,
          "index_count" : 3
        }
      ],
      "built_in_filters" : [
        {
          "name" : "asciifolding",
          "count" : 108,
          "index_count" : 3
        },
        {
          "name" : "lowercase",
          "count" : 111,
          "index_count" : 3
        }
      ],
      "built_in_analyzers" : [ ]
    },
    "versions" : [
      {
        "version" : "7.17.8",
        "index_count" : 39,
        "primary_shard_count" : 47,
        "total_primary_bytes" : 244151894009
      }
    ]
  },
  "nodes" : {
    "count" : {
      "total" : 6,
      "coordinating_only" : 0,
      "data" : 3,
      "data_cold" : 0,
      "data_content" : 0,
      "data_frozen" : 0,
      "data_hot" : 0,
      "data_warm" : 0,
      "ingest" : 3,
      "master" : 3,
      "ml" : 0,
      "remote_cluster_client" : 0,
      "transform" : 0,
      "voting_only" : 0
    },
    "versions" : [
      "7.17.8"
    ],
    "os" : {
      "available_processors" : 42,
      "allocated_processors" : 42,
      "names" : [
        {
          "name" : "Linux",
          "count" : 6
        }
      ],
      "pretty_names" : [
        {
          "pretty_name" : "Ubuntu 20.04.5 LTS",
          "count" : 6
        }
      ],
      "architectures" : [
        {
          "arch" : "amd64",
          "count" : 6
        }
      ],
      "mem" : {
        "total_in_bytes" : 180388626432,
        "free_in_bytes" : 3619905536,
        "used_in_bytes" : 176768720896,
        "free_percent" : 2,
        "used_percent" : 98
      }
    },
    "process" : {
      "cpu" : {
        "percent" : 40
      },
      "open_file_descriptors" : {
        "min" : 453,
        "max" : 722,
        "avg" : 574
      }
    },
    "jvm" : {
      "max_uptime_in_millis" : 3705072692,
      "versions" : [
        {
          "version" : "19.0.1",
          "vm_name" : "OpenJDK 64-Bit Server VM",
          "vm_version" : "19.0.1+10-21",
          "vm_vendor" : "Oracle Corporation",
          "bundled_jdk" : true,
          "using_bundled_jdk" : true,
          "count" : 6
        }
      ],
      "mem" : {
        "heap_used_in_bytes" : 44189679760,
        "heap_max_in_bytes" : 91490353152
      },
      "threads" : 502
    },
    "fs" : {
      "total_in_bytes" : 3343808802816,
      "free_in_bytes" : 3030625738752,
      "available_in_bytes" : 3030525075456
    },
    "plugins" : [
      {
        "name" : "analysis-morfologik",
        "version" : "7.17.8",
        "elasticsearch_version" : "7.17.8",
        "java_version" : "11",
        "description" : "Morfologik Polish Lemmatizer plugin for Elasticsearch",
        "classname" : "pl.allegro.tech.elasticsearch.plugin.analysis.morfologik.AnalysisMorfologikPlugin",
        "extended_plugins" : [ ],
        "has_native_controller" : false,
        "licensed" : false,
        "type" : "isolated"
      },
      {
        "name" : "analysis-stempel",
        "version" : "7.17.8",
        "elasticsearch_version" : "7.17.8",
        "java_version" : "1.8",
        "description" : "The Stempel (Polish) Analysis plugin integrates Lucene stempel (polish) analysis module into elasticsearch.",
        "classname" : "org.elasticsearch.plugin.analysis.stempel.AnalysisStempelPlugin",
        "extended_plugins" : [ ],
        "has_native_controller" : false,
        "licensed" : false,
        "type" : "isolated"
      }
    ],
    "network_types" : {
      "transport_types" : {
        "security4" : 6
      },
      "http_types" : {
        "security4" : 6
      }
    },
    "discovery_types" : {
      "zen" : 6
    },
    "packaging_types" : [
      {
        "flavor" : "default",
        "type" : "docker",
        "count" : 6
      }
    ],
    "ingest" : {
      "number_of_pipelines" : 22,
      "processor_stats" : {
        "conditional" : {
          "count" : 0,
          "failed" : 0,
          "current" : 0,
          "time_in_millis" : 0
        },
        "convert" : {
          "count" : 0,
          "failed" : 0,
          "current" : 0,
          "time_in_millis" : 0
        },
        "geoip" : {
          "count" : 0,
          "failed" : 0,
          "current" : 0,
          "time_in_millis" : 0
        },
        "grok" : {
          "count" : 0,
          "failed" : 0,
          "current" : 0,
          "time_in_millis" : 0
        },
        "gsub" : {
          "count" : 0,
          "failed" : 0,
          "current" : 0,
          "time_in_millis" : 0
        },
        "remove" : {
          "count" : 0,
          "failed" : 0,
          "current" : 0,
          "time_in_millis" : 0
        },
        "rename" : {
          "count" : 0,
          "failed" : 0,
          "current" : 0,
          "time_in_millis" : 0
        },
        "script" : {
          "count" : 0,
          "failed" : 0,
          "current" : 0,
          "time_in_millis" : 0
        },
        "set" : {
          "count" : 0,
          "failed" : 0,
          "current" : 0,
          "time_in_millis" : 0
        },
        "set_security_user" : {
          "count" : 0,
          "failed" : 0,
          "current" : 0,
          "time_in_millis" : 0
        }
      }
    }
  }
}
so we have 6 nodes:
3xmaster nodes 8CPU 8GB RAM
3xdata nodes 16CPU 52 GB RAM
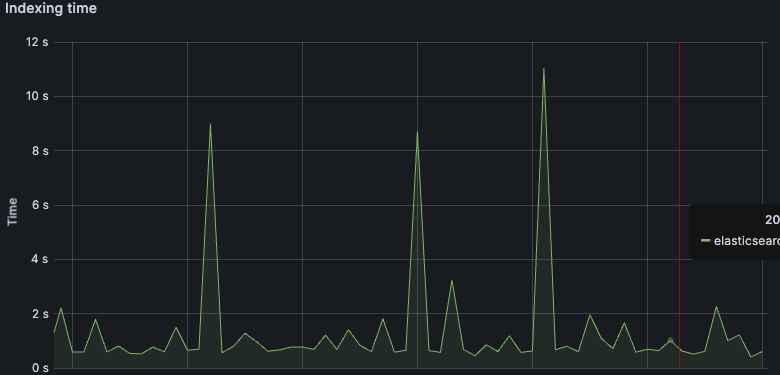
and we're indexing to only one index frequently below the size of shards
btw. I don't know why this shards have the diff size between nodes???
products-327173746                                       1 p STARTED 7155621  32.3gb 10.124.227.55  elasticsearch-es-eck-data-md-0
products-327173746                                       1 r STARTED 7155621  17.5gb 10.124.227.34  elasticsearch-es-eck-data-md-1
products-327173746                                       2 r STARTED 7156295  27.3gb 10.124.227.233 elasticsearch-es-eck-data-md-2
products-327173746                                       2 p STARTED 7156295  30.3gb 10.124.227.34  elasticsearch-es-eck-data-md-1
products-327173746                                       0 p STARTED 7146264  17.6gb 10.124.227.233 elasticsearch-es-eck-data-md-2
products-327173746                                       0 r STARTED 7146264  17.6gb 10.124.227.55  elasticsearch-es-eck-data-md-0
and we're using Premium SSD 1TB per node from Azure