We are observing the query rate on our ES cluster. The stat we are looking at is "nodes.indices.search.query_total" under "GET /_nodes/stats/indices/search".
Here is how the metric looks on our cluster, with the query count on each node stacked one on top of the other. (An aside: the cluster had 8nodes earlier ... which was reduced to 6 nodes)
In the beginning the query count used to be pretty flat. We started running curator at 7:30am and now we notice that the query count shoots up as soon as curator runs and keeps rising until midnight (even though curator finishes running in few minutes). At midnight, query count flattens out until curator is run again (next day at 7:30am).
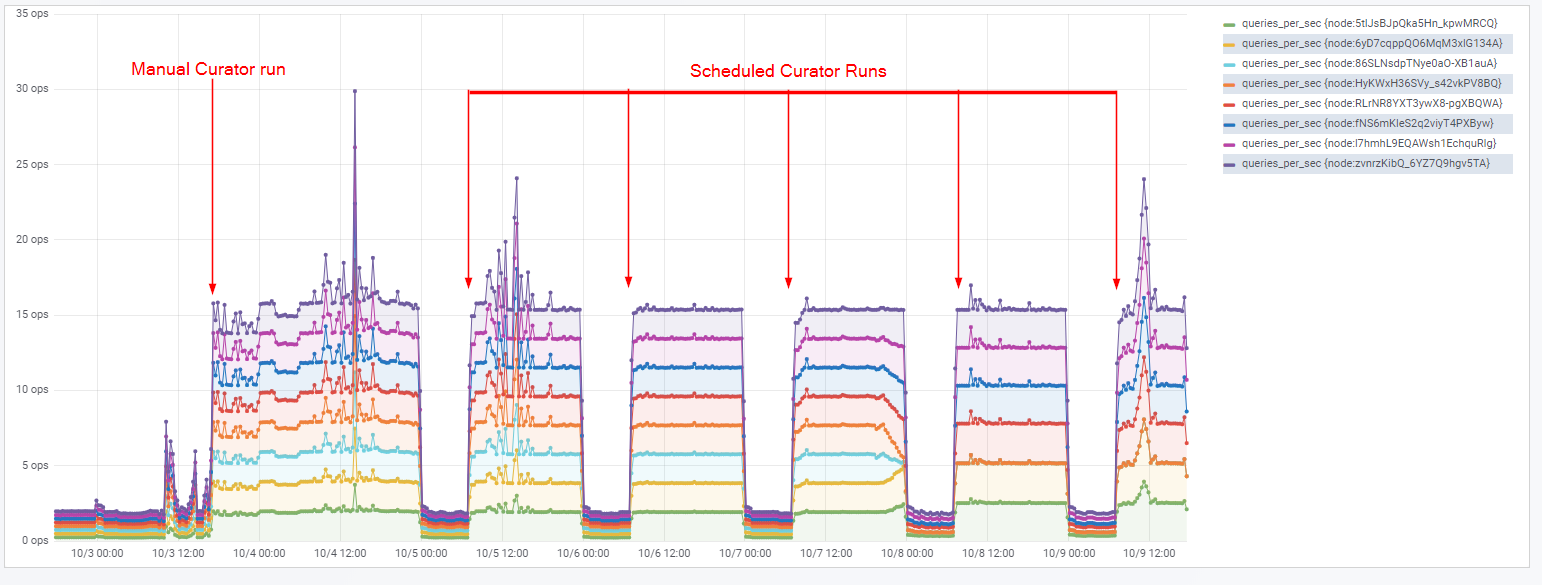
Here is an alternate view of the same metric viewed as a "rate" i.e. queries_per_second:
Normally queries/sec is around 2 queries/sec. However, it goes up to 15queries/sec whenever we run curator and stay up until midnight. At midnight it becomes 2qps and stays there until we run curator again.
Any ideas why/how curator could affect query rate?
The actions in curator yml are: 1. Delete indices older than a week 2. Create snapshot for yesterday's index 3. Delete old snapshots (which is a no op right now as we do not have such old snapshots). The complete actions.yml at the bottom.
Any suggestions on how we can chase this would be greatly appreciated!
actions:
  1:
action: delete_indices
description: >-
  Delete indices older than 8 days (based on index name), for 'filebeat-'
  prefixed indices. Ignore the error if the filter does not result in an
  actionable list of indices (ignore_empty_list) and exit cleanly.
options:
  ignore_empty_list: True
  disable_action: False
filters:
- filtertype: pattern
  kind: prefix
  value: filebeat-
- filtertype: age
  source: name
  direction: older
  timestring: '%Y.%m.%d'
  unit: days
  unit_count: 8
  2:
action: snapshot
description: >-
  Snapshot 'filebeat-' prefixed indices older than 1 day (based on index creation_date).
  Wait for the snapshot to complete.
  Do not skip the repository filesystem access check.
  Use the other options to create the snapshot.
options:
  repository: s3_repository
  name: filebeat-%Y-%m-%d-%H-%M-%S
  ignore_unavailable: False
  include_global_state: True
  partial: False
  wait_for_completion: True
  skip_repo_fs_check: False
  disable_action: False
filters:
- filtertype: pattern
  kind: prefix
  value: filebeat-
- filtertype: age
  source: creation_date
  direction: older
  unit: days
  unit_count: 1
- filtertype: age
  source: creation_date
  direction: younger
  unit: days
  unit_count: 2
  3:
action: delete_snapshots
description: >-
  Delete snapshots from the selected repository older than 21 days
  (based on creation_date), for 'filebeat-' prefixed snapshots.
options:
  repository: s3_repository
  disable_action: False
filters:
- filtertype: pattern
  kind: prefix
  value: filebeat-
  exclude:
- filtertype: age
  source: creation_date
  direction: older
  unit: days
  unit_count: 22
It’s important that you understand that Curator itself isn’t causing the issues you’re seeing. Curator is nothing more nor less than an index selection wrapper around standard Elasticsearch APIs. So the question you should be asking isn’t “what did Curator do?” but rather, “What API call might be causing this behavior?”
The first guess I’m going to put forward is that it’s the snapshot action causing this. The simplest explanation would be that the snapshot API causes a few under-the-hood/behind-the-scenes changes to cluster behavior:
It locks all segments referenced by the selected indices.
Elasticsearch has to compare all local segments identified in step 1 with the segments already existing in the snapshot repository. This is how Elasticsearch performs incremental snapshots: only copying new segments, some of which might be data from older segments which has been merged into new, larger segments.
The new segments are copied to the repository
The segments identified in step 1 are unlocked.
It could be that the comparisons going on are part of the query load, but that could be a red herring. I’ll leave the more technical exposition of what happens during a snapshot to someone in the Elasticsearch team. Regardless, please understand that Curator itself is not the cause of what you’re seeing. If you were to run this API call directly out of Console in Kibana, you would see the same behavior in your monitoring chart.
It’s also very clear that your snapshots are taking a long time to complete (something near 18 hours). How big is “yesterday’s” index? How many nodes in your cluster? How many primary shards in that index? What kind of storage is the repository (s3, fs, azure, hdfs)?
Hi Aaron (@theuntergeek) : You are spot on, I was really curious what action/api that curator is calling is triggering this behavior; which is why I listed the actions configured on curator. Sorry if the post gave a wrong impression .
The thing that makes it more curious for me is that the whole curator job finishes in about an hour (from cron logs). However, the query spike goes on until midnight (yes, exactly midnight when a new index is created).
Like you mention, if this was the actions configured in the curator, then I would expect the spike to last only an hour (as long as the cron job took). However, the whole spike starting exactly along with the cron job and spike ending exactly at midnight makes this whole thing very peculiar.
One thing I can try is verify which action among the three is triggering the spike, by running only one at a time.
I tried to match the execution time of different actions in the yml to the moment of spike in queries per sec.
The delete index action takes 3seconds and the snapshot takes about 25mins.
The spike starts right at the moment cron job starts ... but since delete index is taking only 3seconds, it is unclear if delete index is triggering the spike or if snapshot is triggering the spike
For tomorrow's cron job, we will include only snapshot (and do the delete index manually later). We will also move the cron job scheduled time by 45mins to validate the spike really moves.
We haven't tried doing forceMerge, will explore that option. Is there anything specific you would like us to try?
Elasticsearch version v6.4.0 running on Java8 and Ubuntu 18
So, Curator may perform queries if a filter uses the field stats source. But it’s once for the filter, and then never again. It also calls the Task API every 9 seconds during the snapshot, checking to see if it is complete. I do not think task api calls count towards queries, but these too should stop after completion.
Have you looked to see what tasks are running before and after Curator execution? These queries may reveal themselves there.
We enabled only the snapshot action in the cron job for today's run, there was absolutely no spike in queries per sec. So, the snapshot action is not triggering the spike in queries per sec.
We ran the delete index action independently (outside the cron) after couple of hours. The queries per sec has shot up. So, looks like delete index action is triggering the spike.
Any ideas on why delete index could trigger a spike in queries per second for hours after finishing the delete index operation. And curiously the spike stops exactly at midnight - when a new index gets added; does that give any clues about the problem area?
We are using ES for Logs; so filebeat and kibana are our primary touch-points to ES. There are a few scripts (like curator and monitoring tools) we run that also connect to ES. Will explore if any of them are queries for named indices.
Just so I understand, are you suspecting that there is a client/script/app that is querying the just deleted index by name ... and the queries have spiked because the client is retrying?
Apache, Apache Lucene, Apache Hadoop, Hadoop, HDFS and the yellow elephant
logo are trademarks of the
Apache Software Foundation
in the United States and/or other countries.