Designing a visualisation for success/failure of processes

Hi

Can someone suggest a way to achieve the following:

I'm getting a constant stream of events from a source. These events include data that specifies whether a particular process has completed successfully, as indicated by the presence of these events:

  • Process started successfully

  • Process in progress

  • Process completed successfully

If the process does not complete successfully, the following events would be sent:

  • Process started successfully

  • Process in progress

  • Process failed

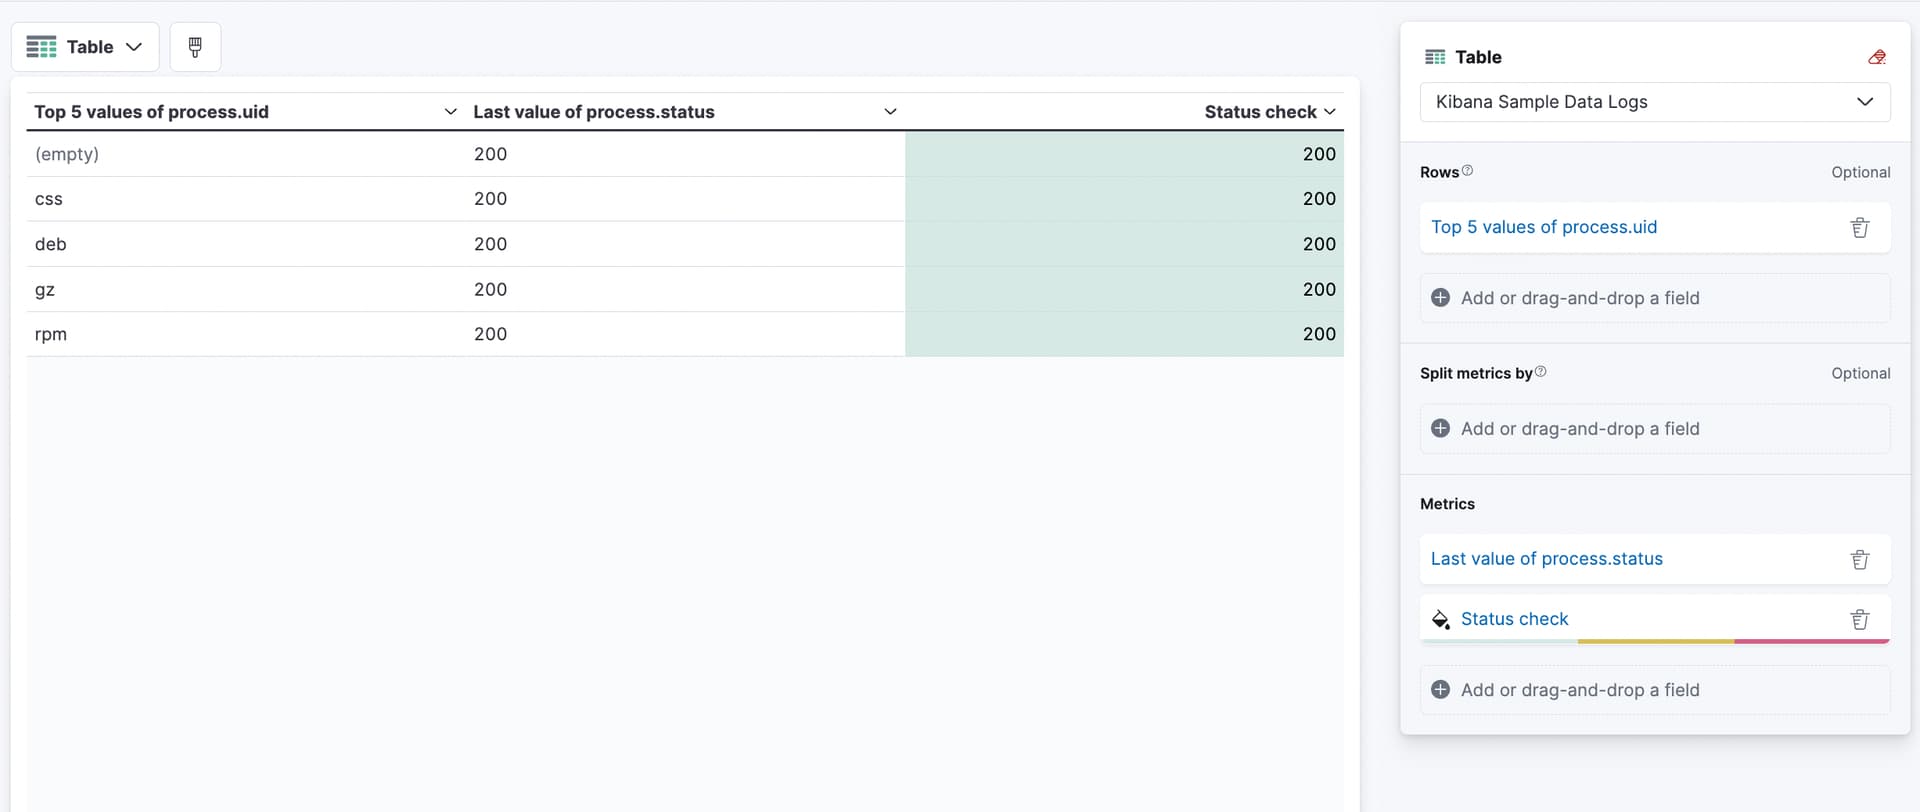
My question is - how can I set up a visualisation(?) in Kibana to display:

  • Process number

  • Process completed successfully (perhaps with a green button/tick) OR

  • Process failed (perhaps with a red button/cross

Thanks in advance
Peter

Hi @PetervH

I think a table might help in this case.
So I built a quick prototype of what I have in mind:

The tricky bit, I think, is to get right the Status check dimension: what I've done is to create a runtime field from the process.status field, creating a new process.status_as_number field which converts the keyword/string value into a mapped number type (i.e. ok => 1, pending => 0, fail => -1)

At this point use the color by value feature to assign colors to the mapped numeric values of the Last value of process.status_as_number.
What do you think?

Thanks, Marco. Will give it a try.

Hi Marco

I'm assuming I need to use a filter like grok to map all my input fields and then to create the runtime field that you suggested (process.status_as_number).

I'd then use an expression to convert the value to a mapped number type.

Finally, I assign a colour to the mapped numeric value.

This topic was automatically closed 28 days after the last reply. New replies are no longer allowed.