I have just started playing around with ELK to develop our log analytics solution.
I had a few questions regarding the best practices so that I don't make any bad choice to begin with.
This tool will analyze various types of logs to find out and correlate any issue. It will run on multiple 'devices' and each device will be uniquely identifiable with a serial number.
Question 1) Is it possible to create a dashboard where the serial number is taken as an user input?
Details: I would like to have 1 dashboard created to analyze various fields and I should be able to specify the serial number of the device as an input. From what I see, I could use filter but then this would need the visualization to be 'edited'. So it appears to be me that right now, if I need to analyze multiple devices then I need to create a dashboard for each of the device. This will be a problem that if I need to modify the dashboard then I will have to make changes to all. The problem can be minimized by importing additional dashboards as a JSON file, still it is inconvenient.
Is there a better way that I am not aware of?
Question 2) On the main dashboard, I want to show a heatmap of various 'services' and their status as a time series. For e.g. say I am monitoring, CPU, memory, network and our service then I want to see something like below:
Now the heatmap visualization doesn't provide a way to uniquely specify the condition. I generated above image by populating dummy data where values were one of 0,1,2,3. Which means that I need to create such data periodically which the visualization can then use. Is there any built-in mechanism (scheduled jobs for e.g.) provided by ELK to do such processing. One option could be to run an external problem which queries Elasticsearch, fetches all the relevant information, analyzes it and puts it back into Elasticssearch. Is that the only way?
If there are any other suggestions, please feel free to share.
For (1) since everything in Kibana is URL, I am thinking to have another webpage to take the serial number as input and accordingly create the URL which will then open the corresponding dashboard
For (2), I am considering doing all the heavy lifting before sending the data to Elasticsearch. I will implement a custom Beats plugin to send all the relevant data to Elasticsearch.
Are both approaches correct?
I find it hard to believe that there will not a provision to take user input within Kibana itself. Thanks.
One solution that I use for the problem in your question 1 is to put a data table with the values that I would want to filter, then I just need to click on one of them to use it as an 'input' for the dashboards, this way I avoid the need to edit the dashboard.
I haven't had the time to play with Kibana 5.5.0, but maybe the new filter feature solves this problem too?
By 'specify the condition' you mean the values range for each color in the heatmap? For examplo 0 to 10, green, 11 to 20, blue, 21 to 30 red ? You can do that in the options tab, custom range.
Are you suggesting to use the filter on the Dashboard where one can specify say the serial number of the device through a query?
Since this tool will be used by multiple folks, I would prefer if they don't have to enter queries which are not simple. I'll look into this option if that's what you mean.
By specifying the condition, I meant different condition for different fields.
For e.g. show CPU as red if usage is > 90%, show memory as red if free memory < 10% along with checks for some of the proprietary services. Right now I can show it if I add this as an additional document with fixed set of values say 0,1,2,3. Hope it is clear now. Thanks.
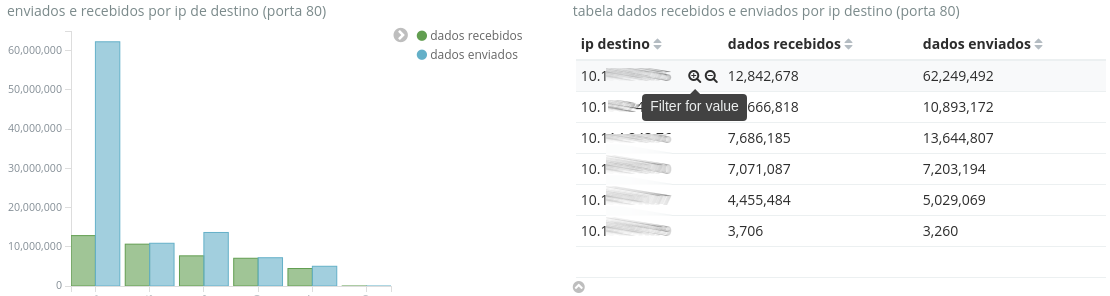
For the first question I was suggesting that you use a data table visualization, with the terms that you want to filter, for example, the serial numbers, them when someone clicks on one of these values, the dashboard will filter based on it and all the other itens in the dashboard will apply this filter.
On the above example I have a bar graph and a table with IPs, when hover on one of the terms in the table, it gives me the option to filter based on this term and the graphic on the side will also apply this filter.
I think that I understand now your second question, you need different custom ranges for the different itens and I think that Kibana does not have a way to do that, Is that right? You will need to parametrize the data before send it to elasticsearch, you can do it using a different field and keep the original value.
It's automatic, it is a query, when you open the dashboard it will run the query and show all the results, you only need to set how many results you want to see in total and per page in the data table visualization.
for selecting the serial number, @leandrojmp's data table approach is a great idea. A simple Terms aggregation in a Data Table visualization would give your dashboard users a list of ids they can page through:
Thanks @weltenwort for the detailed response along with screenshots. I am now able to create the visualization.
My colors question was specific to heatmap visual. which btw, I have now got it working. But your tip will help me in other cases. Thanks again.
Apache, Apache Lucene, Apache Hadoop, Hadoop, HDFS and the yellow elephant
logo are trademarks of the
Apache Software Foundation
in the United States and/or other countries.