Detecting bottleneck in Elasticsearch indexing

I posted about this same issue before but did not get an answer, I continued investigating but I´m still unable to get to the root cause of this.
I have the following configuration in docker containers:
3 ES data nodes for data (6Gb memory each, 3Gb Heap)
1 LS instance (2Gb memory, 1Gb heap)
8 or more filebeats pushing to logstash from different boxes (512Mb each)
This is all working to read and store java logs from more than 40 applications

The core issue is: under regular load, events take about 1-2 minutes to show up in kibana but under stress (we can have spikes of 2,3 or more times our regular load) the time it takes for the events to show up increases drastically, until a point were ES can´t keep up anymore and I start getting "master node not found" errors during what I asume are stop the world GCs due to the increase memory usage. When the load goes down again it takes a few minutes for ES to restore itself and we go back to normal.

During this stress period I don´t see anything alarming in the monitoring data, I don´t see high CPU usage or latency or anything in ES that can indicate why is it dying.

I tried to reproduce the issue with synthetic load, and it seems definetly ES is the bottleneck but I don´t know why.
As you can see in the screenshots below, the load test starts around 11:16 and ends at the 36 minute mark. The thing is, I started with 1 application, but then every 4-5 minutes I added another one, up to 4, and as you can see in the I/O graph for ES it reaches its maximum at the start of the test and it doesn't change even when I added more load.

I never got ES to "colapse" but I reached a 5 minute gap in events showing up in kibana, and even after I stopped the log generation I took about another 5-10 minutes for the load to stop on ES (which I asume is because that was the time it took to catch up).

Another issue I noticed is that if the heavy load lasts for too long, the handlers in filebeats start to pile up, to more than 1000, and it reaches a point were the application uses more than the 512mb limit of the container and gets killed.

Here are some screenshots of the monitoring during the test, please I just need some pointers as to what to look next because I´m completely baffled, I tried increasing memory/heap, I added dedicated SSD disks for each ES instance, i fiddled with many ES configurations as seen in some guides only but to no avail.

Node1

Node2

Node3

Logstash:

Filebeats

1 Like

I don't really see anything suspicious in your graphs and since you haven't shared any logs it's hard to guess what could be the cause of your problem.

One possibility is that the test you ran overwhelmed the thread pool request queue on one or more nodes. If a node gets more requests than its thread_pool max_queue_size (by default 1000) all subsequent requests will be rejected, until the queue is below the maximum again. Which means requests from Kibana and any client application will be dropped. And so are requests from the master, which may cause the cluster state to turn red since the master may no longer be able to communicate with the overwhelmed node(s).

You can check your cluster thread pool status by running this curl command:

curl -XGET 'http://localhost:9200/_cat/thread_pool/generic?v&h=host,name,active,rejected,completed'

If you've had any rejected requests on one of your nodes (since the last restart) it will show up under the rejected column.

I usually monitor the active queue size, since that can give an early warning that the cluster is about to be overwhelmed.

Good luck with the trouble shooting!
bernt

I'm interested in why it's 'normal' for data to take 1-2 minutes to show in Kibana - as with default settings this should be a few seconds under such low loads - that is often changed by the index refresh rate, but on average should take 1/2 the refresh rate to show up, never 1-2 minutes.

When we had delays like that, was always Logstash unable to keep up - your 1GB LS seems small to me as we had issues with that (but with many more filebeats pushing data). Suggest check queue there, too (I don't remember if Kibana shows it; I think maybe not).

And a few filebeats and 40 apps sending logs is not much so odd that ES can't keep up with what I assume is really a small ingest rate. This is a tiny cluster so all this is weird.

But master node not found points to Heap issues on the Master, though graphs don't show that, though not clear if those graphs are load test or normal failure time. 3GB is not very large, though can work if your index count is small. You tried adding more heap to the master?

No Docker CPU caps happening, right?

I will provide logs from my next test, sadly I don´t know when the next heavy load will be so I can't promise "real world" logs.

I will try that during my next test or high load and see.
My filebeats only send monitoring data to ES, all the "heavy load" goes through logstash. Can a single logstash instance exceed the default queue_size of 3 ES nodes?

Docker CPU is uncapped.
The data I showed above is from our staging cluster, which is a bit smaller than prod. This was during a load test, but I never got it to fail, the failure was only experienced during real high loads.
I shared data from our testing env since I can tinker with it and not with prod.

But anyways, for reference here is some data from our prod cluster

3 Es nodes (7Gb memory | 3Gb Heap) running in a single disk
1 LS node (4Gb memory | 2Gb heap)
15 FB nodes (512 memory)

Between all filebeat instances are pushing between 300-400 events per second.
Logstash y pushing the same amount.

Elasticsearch is indexing around 400 documents/s for primary shards and around twice total.

And with those numbers I have a 2-3 minute delay for logs to show up in kibana.

What is your index refresh rate? Default 1sec / open (depends on query, actually by default, so may not get set; you can set to 30s or even less for this index to try to fix that latency).

Also see if you have a queue setup on Logstash, and see if that is monitored.

For master stalls, no idea, but watch GC logs for high GC and make SURE you are not swapping, i.e. have no swap on the VM.

My refresh rate is at 10s, I have it configured in an template. I increased it before in order to help with this issue, maybe I can increase it more.

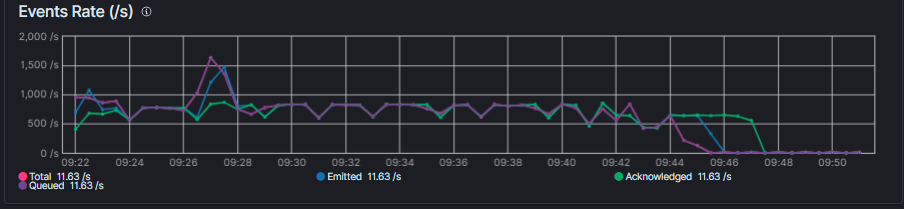
In my configurations I don't explicitly set a queue, but as I understand, the default is an in memory queue:
image
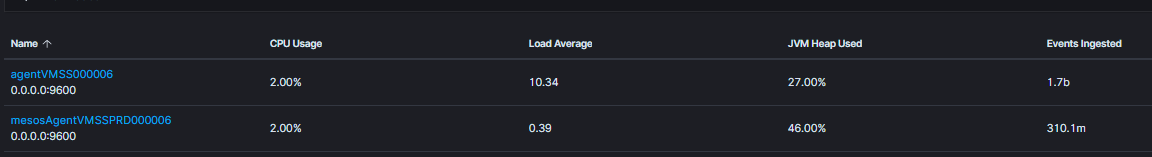
My Logstashes don´t seem to be using all their resources either:

Regarding GC, we see a warining about it all the time, but after spending quite a while looking online for it I was never able to find some conclusive cause or fix. Specially considering that I was told several times, that for the amount of documents I´m ingesting, the resources I have are more than enough, maybe that is incorrect as well, see the memory graph and the logs:

> {"type": "server", "timestamp": "2020-07-23T11:05:53,438Z", "level": "INFO", "component": "o.e.m.j.JvmGcMonitorService", "cluster.name": "docker-cluster", "node.name": "elasticsearch2", "message": "[gc][7366707] overhead, spent [328ms] collecting in the last [1s]", "cluster.uuid": "69cIMsbUTUOiK3MOdNggow", "node.id": "25AFdrnqTG6lRsDR4CxZpQ"  }
> {"type": "server", "timestamp": "2020-07-23T11:06:05,484Z", "level": "INFO", "component": "o.e.m.j.JvmGcMonitorService", "cluster.name": "docker-cluster", "node.name": "elasticsearch2", "message": "[gc][7366719] overhead, spent [281ms] collecting in the last [1s]", "cluster.uuid": "69cIMsbUTUOiK3MOdNggow", "node.id": "25AFdrnqTG6lRsDR4CxZpQ"  }
> {"type": "server", "timestamp": "2020-07-23T11:10:52,967Z", "level": "INFO", "component": "o.e.m.j.JvmGcMonitorService", "cluster.name": "docker-cluster", "node.name": "elasticsearch2", "message": "[gc][7367006] overhead, spent [261ms] collecting in the last [1s]", "cluster.uuid": "69cIMsbUTUOiK3MOdNggow", "node.id": "25AFdrnqTG6lRsDR4CxZpQ"  }
> {"type": "server", "timestamp": "2020-07-23T11:11:13,981Z", "level": "INFO", "component": "o.e.m.j.JvmGcMonitorService", "cluster.name": "docker-cluster", "node.name": "elasticsearch2", "message": "[gc][7367027] overhead, spent [250ms] collecting in the last [1s]", "cluster.uuid": "69cIMsbUTUOiK3MOdNggow", "node.id": "25AFdrnqTG6lRsDR4CxZpQ"  }
> {"type": "server", "timestamp": "2020-07-23T11:12:15,086Z", "level": "INFO", "component": "o.e.m.j.JvmGcMonitorService", "cluster.name": "docker-cluster", "node.name": "elasticsearch2", "message": "[gc][7367088] overhead, spent [272ms] collecting in the last [1s]", "cluster.uuid": "69cIMsbUTUOiK3MOdNggow", "node.id": "25AFdrnqTG6lRsDR4CxZpQ"  }
> {"type": "server", "timestamp": "2020-07-23T11:18:42,537Z", "level": "INFO", "component": "o.e.m.j.JvmGcMonitorService", "cluster.name": "docker-cluster", "node.name": "elasticsearch2", "message": "[gc][7367475] overhead, spent [258ms] collecting in the last [1s]", "cluster.uuid": "69cIMsbUTUOiK3MOdNggow", "node.id": "25AFdrnqTG6lRsDR4CxZpQ"  }
> {"type": "server", "timestamp": "2020-07-23T11:19:03,579Z", "level": "INFO", "component": "o.e.m.j.JvmGcMonitorService", "cluster.name": "docker-cluster", "node.name": "elasticsearch2", "message": "[gc][7367496] overhead, spent [292ms] collecting in the last [1s]", "cluster.uuid": "69cIMsbUTUOiK3MOdNggow", "node.id": "25AFdrnqTG6lRsDR4CxZpQ"  }
> {"type": "server", "timestamp": "2020-07-23T11:19:23,607Z", "level": "INFO", "component": "o.e.m.j.JvmGcMonitorService", "cluster.name": "docker-cluster", "node.name": "elasticsearch2", "message": "[gc][7367516] overhead, spent [254ms] collecting in the last [1s]", "cluster.uuid": "69cIMsbUTUOiK3MOdNggow", "node.id": "25AFdrnqTG6lRsDR4CxZpQ"  }
> {"type": "server", "timestamp": "2020-07-23T11:20:25,730Z", "level": "INFO", "component": "o.e.m.j.JvmGcMonitorService", "cluster.name": "docker-cluster", "node.name": "elasticsearch2", "message": "[gc][7367578] overhead, spent [255ms] collecting in the last [1s]", "cluster.uuid": "69cIMsbUTUOiK3MOdNggow", "node.id": "25AFdrnqTG6lRsDR4CxZpQ"  }
> {"type": "server", "timestamp": "2020-07-23T11:28:55,680Z", "level": "INFO", "component": "o.e.m.j.JvmGcMonitorService", "cluster.name": "docker-cluster", "node.name": "elasticsearch2", "message": "[gc][7368087] overhead, spent [276ms] collecting in the last [1s]", "cluster.uuid": "69cIMsbUTUOiK3MOdNggow", "node.id": "25AFdrnqTG6lRsDR4CxZpQ"  }
> {"type": "server", "timestamp": "2020-07-23T11:33:04,049Z", "level": "INFO", "component": "o.e.m.j.JvmGcMonitorService", "cluster.name": "docker-cluster", "node.name": "elasticsearch2", "message": "[gc][7368335] overhead, spent [288ms] collecting in the last [1s]", "cluster.uuid": "69cIMsbUTUOiK3MOdNggow", "node.id": "25AFdrnqTG6lRsDR4CxZpQ"  }
> {"type": "server", "timestamp": "2020-07-23T11:38:23,693Z", "level": "INFO", "component": "o.e.m.j.JvmGcMonitorService", "cluster.name": "docker-cluster", "node.name": "elasticsearch2", "message": "[gc][7368654] overhead, spent [262ms] collecting in the last [1s]", "cluster.uuid": "69cIMsbUTUOiK3MOdNggow", "node.id": "25AFdrnqTG6lRsDR4CxZpQ"  }
> {"type": "server", "timestamp": "2020-07-23T11:39:35,840Z", "level": "INFO", "component": "o.e.m.j.JvmGcMonitorService", "cluster.name": "docker-cluster", "node.name": "elasticsearch2", "message": "[gc][7368726] overhead, spent [292ms] collecting in the last [1s]", "cluster.uuid": "69cIMsbUTUOiK3MOdNggow", "node.id": "25AFdrnqTG6lRsDR4CxZpQ"  }
> {"type": "server", "timestamp": "2020-07-23T11:42:21,277Z", "level": "INFO", "component": "o.e.m.j.JvmGcMonitorService", "cluster.name": "docker-cluster", "node.name": "elasticsearch2", "message": "[gc][7368891] overhead, spent [260ms] collecting in the last [1s]", "cluster.uuid": "69cIMsbUTUOiK3MOdNggow", "node.id": "25AFdrnqTG6lRsDR4CxZpQ"  }
> {"type": "server", "timestamp": "2020-07-23T11:45:30,724Z", "level": "INFO", "component": "o.e.m.j.JvmGcMonitorService", "cluster.name": "docker-cluster", "node.name": "elasticsearch2", "message": "[gc][7369080] overhead, spent [272ms] collecting in the last [1s]", "cluster.uuid": "69cIMsbUTUOiK3MOdNggow", "node.id": "25AFdrnqTG6lRsDR4CxZpQ"  }
> {"type": "server", "timestamp": "2020-07-23T11:46:42,840Z", "level": "INFO", "component": "o.e.m.j.JvmGcMonitorService", "cluster.name": "docker-cluster", "node.name": "elasticsearch2", "message": "[gc][7369152] overhead, spent [281ms] collecting in the last [1s]", "cluster.uuid": "69cIMsbUTUOiK3MOdNggow", "node.id": "25AFdrnqTG6lRsDR4CxZpQ"  }
> {"type": "server", "timestamp": "2020-07-23T11:46:53,862Z", "level": "INFO", "component": "o.e.m.j.JvmGcMonitorService", "cluster.name": "docker-cluster", "node.name": "elasticsearch2", "message": "[gc][7369163] overhead, spent [262ms] collecting in the last [1s]", "cluster.uuid": "69cIMsbUTUOiK3MOdNggow", "node.id": "25AFdrnqTG6lRsDR4CxZpQ"  }
> {"type": "server", "timestamp": "2020-07-23T12:00:03,567Z", "level": "INFO", "component": "o.e.m.j.JvmGcMonitorService", "cluster.name": "docker-cluster", "node.name": "elasticsearch2", "message": "[gc][7369951] overhead, spent [281ms] collecting in the last [1s]", "cluster.uuid": "69cIMsbUTUOiK3MOdNggow", "node.id": "25AFdrnqTG6lRsDR4CxZpQ"  }
> {"type": "server", "timestamp": "2020-07-23T12:04:54,188Z", "level": "INFO", "component": "o.e.m.j.JvmGcMonitorService", "cluster.name": "docker-cluster", "node.name": "elasticsearch2", "message": "[gc][7370241] overhead, spent [264ms] collecting in the last [1s]", "cluster.uuid": "69cIMsbUTUOiK3MOdNggow", "node.id": "25AFdrnqTG6lRsDR4CxZpQ"  }
> {"type": "server", "timestamp": "2020-07-23T12:05:36,324Z", "level": "INFO", "component": "o.e.m.j.JvmGcMonitorService", "cluster.name": "docker-cluster", "node.name": "elasticsearch2", "message": "[gc][7370283] overhead, spent [274ms] collecting in the last [1s]", "cluster.uuid": "69cIMsbUTUOiK3MOdNggow", "node.id": "25AFdrnqTG6lRsDR4CxZpQ"  }
> {"type": "server", "timestamp": "2020-07-23T12:06:17,437Z", "level": "INFO", "component": "o.e.m.j.JvmGcMonitorService", "cluster.name": "docker-cluster", "node.name": "elasticsearch2", "message": "[gc][7370324] overhead, spent [263ms] collecting in the last [1s]", "cluster.uuid": "69cIMsbUTUOiK3MOdNggow", "node.id": "25AFdrnqTG6lRsDR4CxZpQ"  }
> {"type": "server", "timestamp": "2020-07-23T12:12:43,241Z", "level": "INFO", "component": "o.e.m.j.JvmGcMonitorService", "cluster.name": "docker-cluster", "node.name": "elasticsearch2", "message": "[gc][7370709] overhead, spent [265ms] collecting in the last [1s]", "cluster.uuid": "69cIMsbUTUOiK3MOdNggow", "node.id": "25AFdrnqTG6lRsDR4CxZpQ"  }
> {"type": "server", "timestamp": "2020-07-23T12:13:04,272Z", "level": "INFO", "component": "o.e.m.j.JvmGcMonitorService", "cluster.name": "docker-cluster", "node.name": "elasticsearch2", "message": "[gc][7370730] overhead, spent [263ms] collecting in the last [1s]", "cluster.uuid": "69cIMsbUTUOiK3MOdNggow", "node.id": "25AFdrnqTG6lRsDR4CxZpQ"  }
> {"type": "server", "timestamp": "2020-07-23T12:18:33,978Z", "level": "INFO", "component": "o.e.m.j.JvmGcMonitorService", "cluster.name": "docker-cluster", "node.name": "elasticsearch2", "message": "[gc][7371059] overhead, spent [322ms] collecting in the last [1s]", "cluster.uuid": "69cIMsbUTUOiK3MOdNggow", "node.id": "25AFdrnqTG6lRsDR4CxZpQ"  }
> {"type": "server", "timestamp": "2020-07-23T12:26:23,285Z", "level": "INFO", "component": "o.e.m.j.JvmGcMonitorService", "cluster.name": "docker-cluster", "node.name": "elasticsearch2", "message": "[gc][7371527] overhead, spent [252ms] collecting in the last [1s]", "cluster.uuid": "69cIMsbUTUOiK3MOdNggow", "node.id": "25AFdrnqTG6lRsDR4CxZpQ"  }
> {"type": "server", "timestamp": "2020-07-23T12:31:03,810Z", "level": "INFO", "component": "o.e.m.j.JvmGcMonitorService", "cluster.name": "docker-cluster", "node.name": "elasticsearch2", "message": "[gc][7371807] overhead, spent [295ms] collecting in the last [1s]", "cluster.uuid": "69cIMsbUTUOiK3MOdNggow", "node.id": "25AFdrnqTG6lRsDR4CxZpQ"  }
> {"type": "server", "timestamp": "2020-07-23T12:31:24,843Z", "level": "INFO", "component": "o.e.m.j.JvmGcMonitorService", "cluster.name": "docker-cluster", "node.name": "elasticsearch2", "message": "[gc][7371828] overhead, spent [308ms] collecting in the last [1s]", "cluster.uuid": "69cIMsbUTUOiK3MOdNggow", "node.id": "25AFdrnqTG6lRsDR4CxZpQ"  }
> {"type": "server", "timestamp": "2020-07-23T12:34:47,362Z", "level": "INFO", "component": "o.e.m.j.JvmGcMonitorService", "cluster.name": "docker-cluster", "node.name": "elasticsearch2", "message": "[gc][7372030] overhead, spent [327ms] collecting in the last [1s]", "cluster.uuid": "69cIMsbUTUOiK3MOdNggow", "node.id": "25AFdrnqTG6lRsDR4CxZpQ"  }
> {"type": "server", "timestamp": "2020-07-23T12:34:51,374Z", "level": "INFO", "component": "o.e.m.j.JvmGcMonitorService", "cluster.name": "docker-cluster", "node.name": "elasticsearch2", "message": "[gc][7372034] overhead, spent [286ms] collecting in the last [1s]", "cluster.uuid": "69cIMsbUTUOiK3MOdNggow", "node.id": "25AFdrnqTG6lRsDR4CxZpQ"  }
> {"type": "server", "timestamp": "2020-07-23T12:35:07,592Z", "level": "INFO", "component": "o.e.m.j.JvmGcMonitorService", "cluster.name": "docker-cluster", "node.name": "elasticsearch2", "message": "[gc][7372050] overhead, spent [252ms] collecting in the last [1s]", "cluster.uuid": "69cIMsbUTUOiK3MOdNggow", "node.id": "25AFdrnqTG6lRsDR4CxZpQ"  }
> {"type": "server", "timestamp": "2020-07-23T12:35:43,887Z", "level": "INFO", "component": "o.e.m.j.JvmGcMonitorService", "cluster.name": "docker-cluster", "node.name": "elasticsearch2", "message": "[gc][7372086] overhead, spent [274ms] collecting in the last [1s]", "cluster.uuid": "69cIMsbUTUOiK3MOdNggow", "node.id": "25AFdrnqTG6lRsDR4CxZpQ"  }
> {"type": "server", "timestamp": "2020-07-23T12:36:27,164Z", "level": "INFO", "component": "o.e.m.j.JvmGcMonitorService", "cluster.name": "docker-cluster", "node.name": "elasticsearch2", "message": "[gc][7372129] overhead, spent [405ms] collecting in the last [1s]", "cluster.uuid": "69cIMsbUTUOiK3MOdNggow", "node.id": "25AFdrnqTG6lRsDR4CxZpQ"  }
> {"type": "server", "timestamp": "2020-07-23T12:40:25,387Z", "level": "INFO", "component": "o.e.m.j.JvmGcMonitorService", "cluster.name": "docker-cluster", "node.name": "elasticsearch2", "message": "[gc][7372365] overhead, spent [269ms] collecting in the last [1s]", "cluster.uuid": "69cIMsbUTUOiK3MOdNggow", "node.id": "25AFdrnqTG6lRsDR4CxZpQ"  }

Sorry, I have no idea - your GC looks good and fast, 250ms every few minutes (though check all nodes, especially the master) - maybe set a persistent queue on LS and check it so you can see when it gets backed up; and make sure LS not single core bound - load average of 10 is quite a lot for a LS machine, so you should understand that, maybe waiting on network, but if not, then it's using 10 CPU cores which is a lot.

Steve, thank you for all the help so far, here is the full pic of logstash:


I suspected of logstash, so during my testing (in the other environment) I added a second instance of it to process half the load.
And also added more workers to it.
Still, ES maxed out the IO at around the same number.

Note there are questions earlier in this thread like showing your thread pools that I don't see answers for.

Also, what is the batch size and did you try reducing that, like by half or 75% to see its effects? No batch errors/retries, right (will show as exceptions in LS log I think).

You mention "ES maxed out the IO" - do you see max IO somewhere, or just in index rate?

Yeh, the test environment has been in use these days so my testing has been postponed. I need to run another load test with @Bernt_Rostad suggestions and report the results.
I will try different batch sizes and report that aswell. Right now I´m running with 125 as shown in my last screenshot.

As for ES I/O operations, I though it may help me identify what ES is doing or if it is having problems keeping up. For example here is my test env under minimal load:

For comparison here is the PROD env under regular load:

Now my plan for my load test was, I have 4 applications and start hitting each one sequentialy to see where it plateaus, trying to detect if maybe the disk was a bottleneck.
As you can see from one of my previous screenshots, it stays at around 100-150 I/O per sec.


The interesting part is that I reach that number with 1 application logging, 1 filebeat harvesting and 1 logstash processing and pushing. So that is why I suspect that ES is the bottleneck.

You are on SATA spinning disks? If so, 100-150 IOPS is okay, but far too low for SSD/EBS, etc.

For some reason thought you batch size was much higher - 125 for logs is not very big; you can try larger too.

Still need to see the queues - and these logs are going to several indexes, right? So should be multi-threading (I think) on the data nodes (I believe each node single-threads on a shard).

In Docker, you are on volumes, right, not bind mounts (huge performance difference).

Do you still get master node not found errors? That would still indicate serious instability / resource issues somewhere, i.e. the master. You mention 3 data nodes, but not your master situation and no graphs/data from the masters ... they play key parts in all this, of course - and what nodes to the filebeat/logstash point to?

They are running on azure disks, according to our configuration, for test env we are using "Standard SSD" and for prod "Standard HDD" (we upgraded test but still need to upgrade prod). Still many of the features of the "hardware" are controlled by azure, so I never know what to expect.
I tried different batch sizes along with different number of workers, not much difference from 125 and upwards, made me think the bottleneck is somewhere else.
Can you provide more instructions on how to show you the queues?
Logs go to the same index, but it has 5 shards:


Docker is workinmg on volumes, for ES for example, each node maps its data to a dedicated disk.

I haven´t seen the master not found again, but we haven´t experienced heavy loads, the error only appears when we process a huge amount of data during the span of almost an hour.

In regards to my masters. In my configuration I have 3 master elegible nodes that are also data nodes. Any of the 3 nodes I have been showing you could be the master.
Is there any specific info about the master you would like to see?
Logstash pushes logs to all 3 ES nodes, and filebeats pushes logs to logstash only.

If it is hosted on Azure I would recommend using premium storage. At least try it to see if that has any impact. With standard storage I would not rule out that you are limited by disk I/O.

Ok I can try, I suspected of this, we were running all 3 nodes in the same "Standard HDD" so I switched them to 3 dedicated "Stadard SSD" and didn't see the performance increase that I was expecting, especially for going from 1 to 3 disks. But still azure works in mysterious ways, so maybe Premium is the way to go.
I will try to convince management to give me 3 more disk and let you know how that goes :smile:

At least get off Standard HDD which I read as spinning magnetic disks of metal that you don't want :wink: 
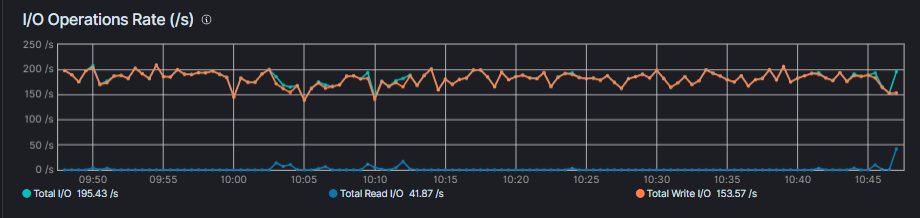
though if SSD no faster, that's odd as should be big difference if disks are issue.

For threads, something like this:
GET /_cat/thread_pool?v&h=nn,n,t,a,s,q,qs,r,l,c,mi,mx&s=nn

Still something here we don't understand - I just noticed you only have 1GB heap for LS; you might increase that - any chance the Filebeats can push to ES directly?

Yeah, if it was a real SSD vs HDD then we know what to expect, but since these are azure resources then we are in a different world.
I tried again, adding a second LS instance and ran a new test, for the threads I think the issue is not there:
image
At no point those numbers changed from 0, under any load.
What I did notice is that filebeat seems to flat out pretty fast and keeps a pretty "regular" shape:


I have seen big spikes in filebeat, so the instances can push more than that. For example, when I restart all my filebeats, right after I see a spike, when it catches up, so my guess is, reading from disk is not the problem, but maybe writing is.
My theory now is, since all my applications are wirting logs to the same disk, it is possible that when under load they max out the disk writing capabilities, so no matter how much ELK resources I have, the logs are just not there. I will try running an application from a different disk and see what happens.

Finally I think I got it, it was logstash all along, increasing the workers to 4 and the batch size to 512 improved drastically the cluster performance:


I had not paid attention to this option before, because when I added a second logstash instance I did not see much improvement.
It seems like the load was not very balanced between the two logstash, so my cluster worked better with 1 logstash with 2 workers and 256 batch, than having two logstashes. After this success I increased even more to 4 and 512 for those results.
Next step is increasing logstash dedicated and heap memory to further increase the batch size, but I´m already super happy. thank you guys!

This topic was automatically closed 28 days after the last reply. New replies are no longer allowed.