I have a Node + Java application that I created specifically to explore distributed tracing for Elastic APM. I used this to test from Elastic Stack 6.6.x and have seen distributed tracing work. When I upgraded Elastic Stack to 7.0.0, I also upgraded Chrome. Distributed tracing stopped working for Chrome. Upgrading to Elastic Stack 7.0.1 and 7.1.0 yielded the same result. Distributed tracing still works for Safari and Firefox.
Is there a known issue for this? I am currently using Chrome 74.0.3729.157 on a Mac Book Pro 2018.
I've also turned off Ghostery as well as DNT, and followed the suggestions on SO to turn off certain flags on Chrome 72+ for somewhat similar issues: https://stackoverflow.com/questions/21177387/caution-provisional-headers-are-shown-in-chrome-debugger
CORS settings are set to most permissive. I've also tested on Incognito mode as well as Guest mode.
I am testing side by side Chrome against Firefox on my laptop and DT works fine.
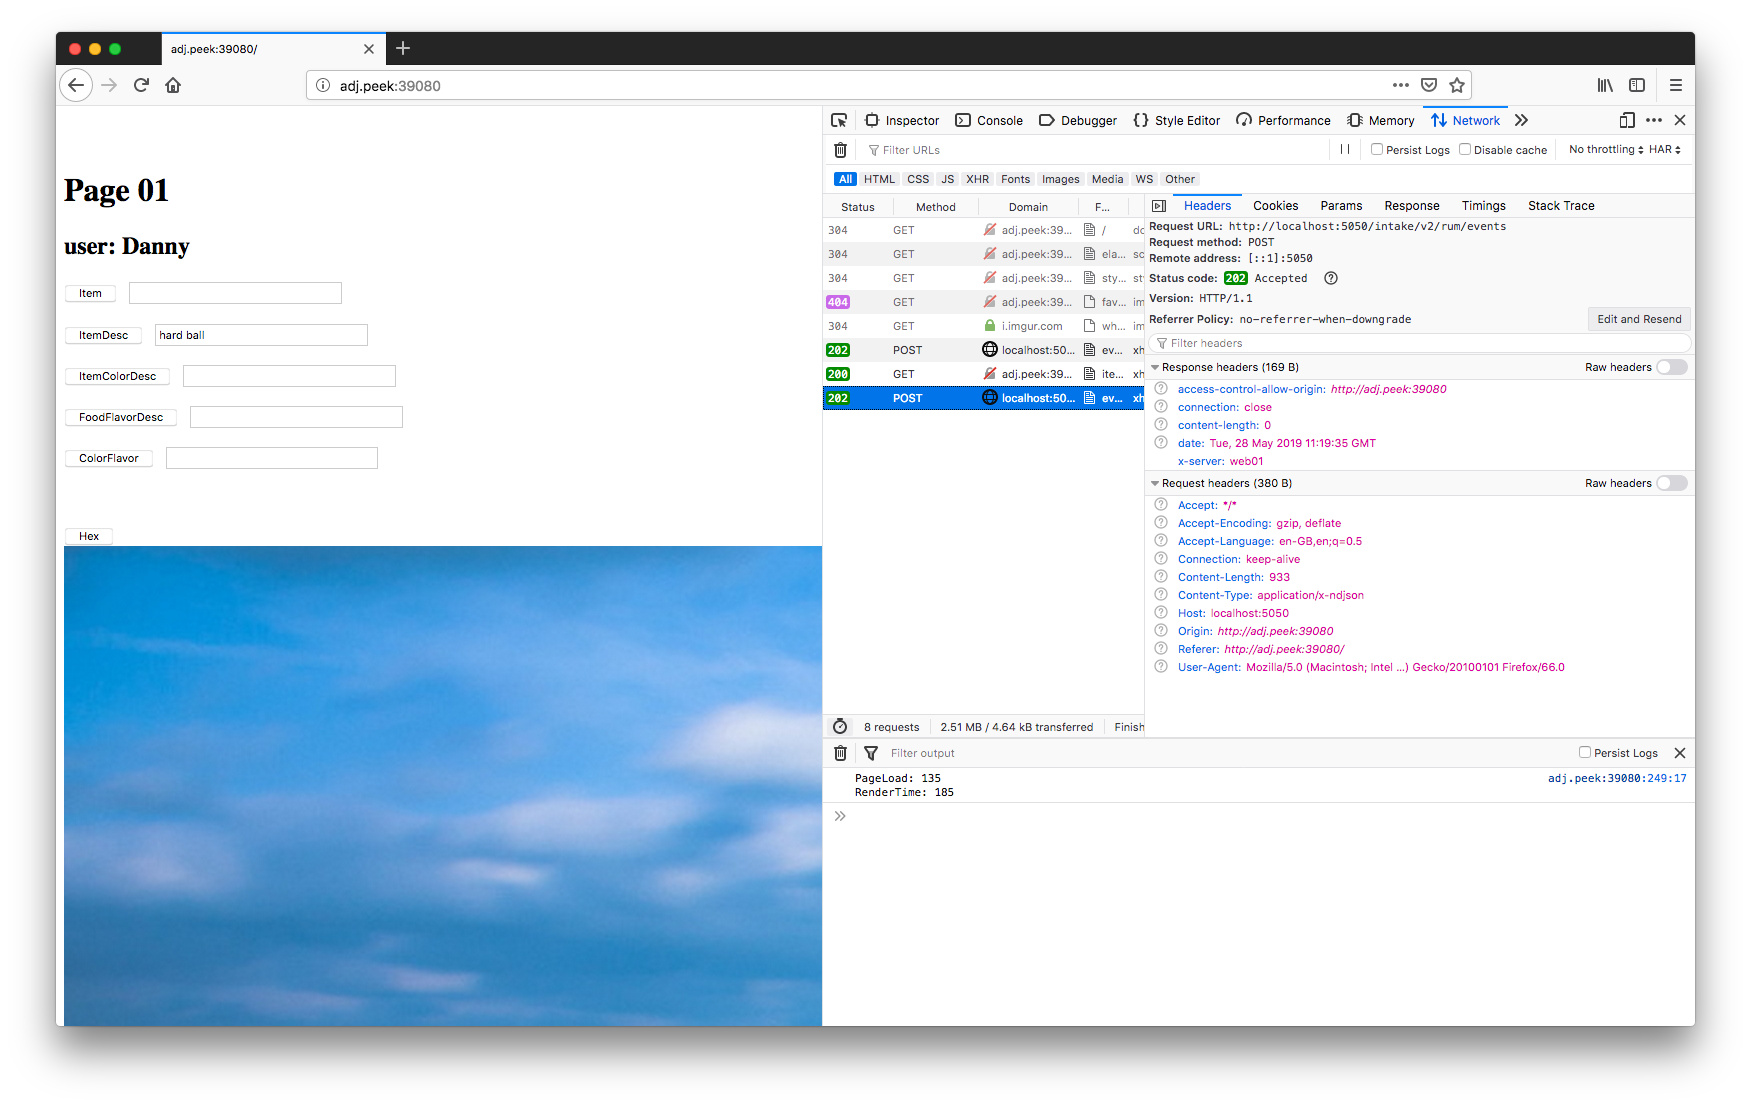
Some observations:
Chrome shows only two methods per call, OPTION and GET which both return a 200 status.
Firefox does 3 methods per call at the start , OPTIONS, GET and POST. The first two result in a 200 while the latter results in a 202. On subsequent calls for that session, it only does GET and POST with a 200 and 202 respectively.
I've installed Elastic 6.6.0 again, but did not downgrade Chrome. DT still doesn't work. I can't downgrade Chrome due to company restrictions.
It seems that in the case of Chrome, a transaction has ended early and therefore it doesn't capture the GET request that comes after it.
Would you please add debug: true to the RUM agent configuration and post the content of your console here?
Also, please provide the part of your code that makes the GET request to itemdescribe
The other possibility is that If you are starting a custom Transaction that captures the GET request but isn't sent to the APM server, so please provide those parts of your code as well.
Thanks for the initial look.
To further clarify, the distributed trace correlation works in Safari and Firefox, but not Chrome.
However, the individual transactions themselves get recorded regardless of the initiating browser.
So a quick description on Chrome is this (under the assumption transactions have not been made on any other browser, Kibana is opened in Chrome):
Execute the XHR call with a custom transaction, say apm.startTransaction("callItemDescribed","rum_peekweb") under the service peekWeb
This makes a GET call to some Java REST service, /itemdescribed
/itemdescribed makes a GET call to another Java service, and so on
Under the Services view, click peekWeb and it goes to the Transaction view. No dropdown appears to show filter by type, so can't view type "rum_peekWeb"
Now, do steps 1-3 above but execute the in Firefox. Going back to Kibana, the dropdown then appears and the distributed trace for callItemDescribed can be seen. Despite repeated executions, only those executed in Firefox/Safari gets registered in this view.
I've pasted the relevant items you asked below:
Instrumented Call that makes the GET
function callItemDescribed(){

    url = 'http://adj.peek:39001/itemdescribe';
    var transaction = apm.startTransaction("MainPage_callItemDescribed","rum_peekWeb");
    http.open('GET', url, true);

    http.onreadystatechange = function() {//Call a function when the state changes.
        if(http.readyState == 4 && http.status == 200) {
            resp = http.response;
            document.getElementById("txtItemDescribed").value = resp
        }

        transaction.end();
    }
    http.send(null);
}
Apache, Apache Lucene, Apache Hadoop, Hadoop, HDFS and the yellow elephant
logo are trademarks of the
Apache Software Foundation
in the United States and/or other countries.