lstoneir
April 20, 2021, 8:14am
1
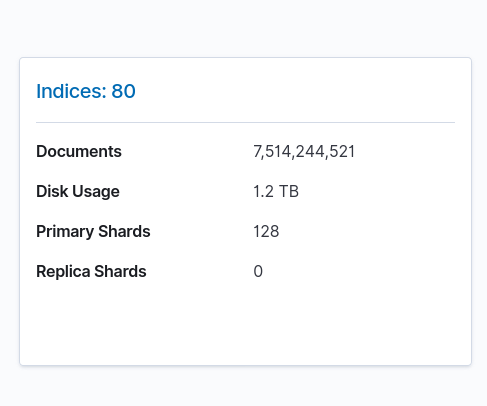
this is kibana stack monitoring area:
when i run du -ha /var | sort -rh | head -40 see this :
1.7T	/var
1.5T	/var/lib/elasticsearch/nodes/0/indices
1.5T	/var/lib/elasticsearch/nodes/0
1.5T	/var/lib/elasticsearch/nodes
1.5T	/var/lib/elasticsearch
1.5T-1.2T = 300GB !!!
what is this 300GB? how can i delete it?
warkolm
April 20, 2021, 10:55pm
2
It could be due to pending shard merges. Is it causing issues?
lstoneir
April 22, 2021, 5:37am
3
yes my hdd usage was 90%
warkolm
April 22, 2021, 5:38am
4
What is the output from the _cluster/stats?pretty&human API?
lstoneir
April 22, 2021, 5:44am
5
As I said I wanted to delete. Now, after deleting some of the original indices, 60% of the hard drive is used!
I had to delete. The server had a serious problem.
It's still interesting to me, but what is that 300 GB?
warkolm
April 22, 2021, 9:11am
6
What is the output from the _cluster/stats?pretty&human API?