Is this correct? But it still gives the wrong value.
Actual value should be 95.23%
In last 15 minutes
Total number of success transactions : 20
Total transactions : 21
Percentage is 95.23
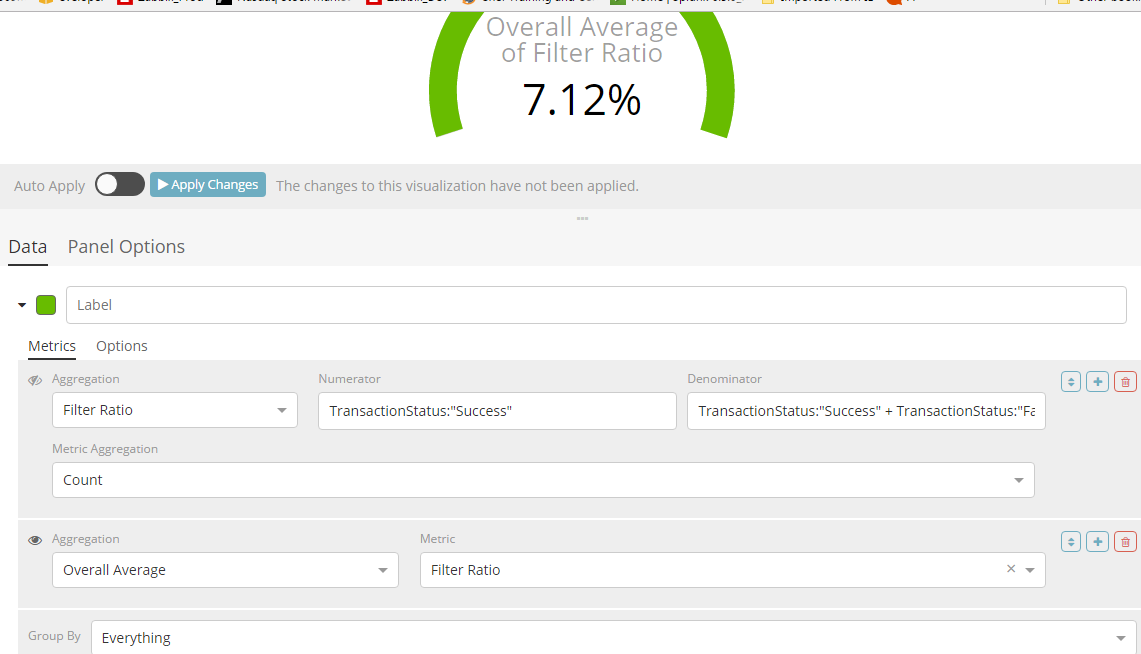
I don't think you want that + in your Denominator (although it seems to work OK in Discover). That field is a Lucence query which doesn't add results like that. You basically want it to select docs which match either term, so it's an OR, which is the default when you just list 2 terms.
But I think it's probably ignoring the +, so there must be some other issue.
When I select a field that has different values in Discover it shows the percentage of each value. This shows the percent of jpg is 64.8;

And the Visual Builder shows a very similar result;


Is there any other way of doing this percentage calculation? Like using the scripted field or in the logstash config,
I dont want to change anything in the logstash config though just for this calculation, i want to understand the Maths basics of kibana because there will be lot of requirements like this coming in future.
I think you're going to have take a few steps backwards to figure out where the problem is. I would suggest to create another Visual Builder where you just get the Counts based on Filters like this. In this case we're clicking the + forAdd Series instead of Add Metric.
If you do this with your Success and Failure, are you seeing your correct counts?


Hi Lee,
Any luck with any more steps to achieve this?
Can you show the Time Series tab of the Visual Builder again? Are you not getting any results? If not, can you change your Time Picker to some time where you have data?
I see a spike when i create this visualisation again, see the screenshot.


Actually if i count the numbers on Spike manually, i am getting the right value which i see in the discover tab i.e 15 for today.

On the right side, it shows 0, not sure how do i actually calculate it real time.
Hi Lee,
any update on this?
On the Time Series tab, the number on the far right is the last value. So that would explain why it's currently showing 0. That's why we were using the Overall Average aggregation.
I've seen a couple of people ask for a simple metric value that gives the ratio of 2 values now, so maybe we need a new feature to make this easier. I'll file an enhancement request issue in github for it.
With the existing feature can we achieve what i want?
I thought what I described in my first post in this thread should work for you. In fact, this post is already being referenced to other users who ask a similar question.
I'm not sure why you had some of the problems you've had but there's not any other feature in Kibana that does this.