Hi
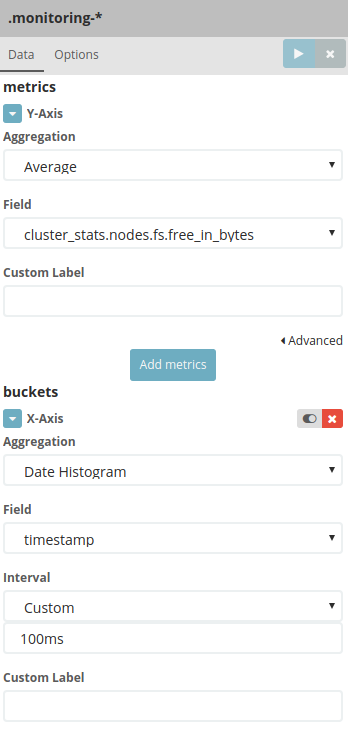
Have a visualisation plot, where x axis is the event occurrence time. Currently, I am able to set the time window of interest via number of points in x-axis, e.g., in the case shown below ,1e6 points corresponds to 10 hours.:

I am wondering if it is possible to define 1:n downsampling ratio for a given range, e.g., drop every 2nd sample, while preserving the same range, thus reducing the number of samples to 5e5.
Cheers,