Drop of some of the Prometheus based metrics at metric beat end

Hi Team,

I followed your document to get prometheus metrics in elasticsearch using metricbeat. But metricbeat is not showing all metrics on kibana dashboard.

Below is Prometheus metrics

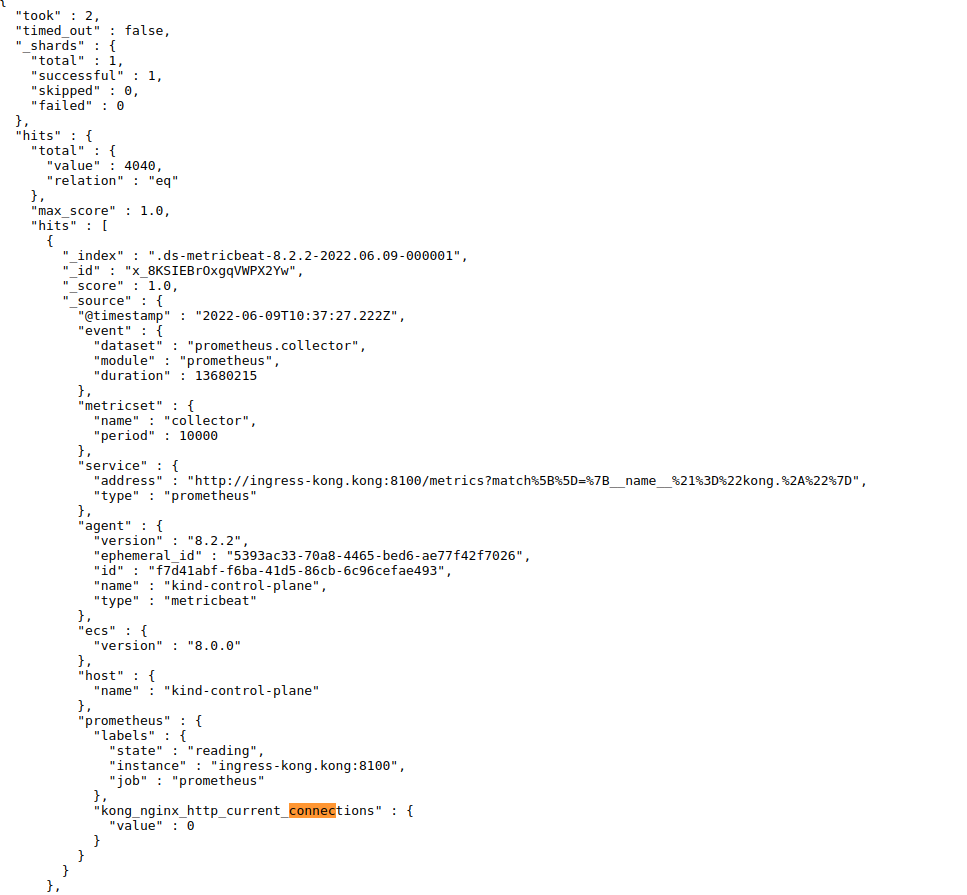
On a metricbeat side It is only showing one metrics not its subset.

Metric Beat is showing only one metric. Below is the screenshot.

Below is the module which I am using to fetch the prometheus metric.

Module is

  prometheus.yml: |-
    - module: prometheus
      period: 10s
      metricsets: ["collector"]
      hosts: ["ingress-kong.kong:8100"]
      metrics_path: /metrics
      headers:
        accept: "text/plain"

Hi Sagar,

Just a couple ideas:

Have you checked the metricbeat logs for errors?

Any chance something is setting metrics_filters causing only certain fields to get included?

I haven't had any trouble using the prometheus integration via elastic agent to ingest multiple metrics, but if there was some problem I would expect it to show up in the collector logs (agent in my case, metricbeat in yours).

This topic was automatically closed 28 days after the last reply. New replies are no longer allowed.