Before we rollout the elastic agent with the integrations “Elastic Defend”, “Windows” and “System” we would like to know exactly how much RAM and CPU are being used by those compo-nents (and in total including all sub processes). To do that we compared the values from the [Elastic Agent] Agent metrics dashboard with the amount of used memory shown on Windows with Powershell/TaskMgr. As a result the following questions arise:
[Elastic Agent] Dashboard = > «Agent-Level Metrics»
On server A, memory usage is supposedly around 512 MB (printscreen 1 below).

To which process(es) does this amount apply to? On the server I see elastic-agent.exe process with around 50MB RAM (working set).
![]()

How is the 512 MB value calculated?
Question #2:
[Elastic Agent] Dashboard = > «Component-Level Metrics».
Under Component-Level Metrics we see graphs for every single component like endpoint_security, metricbeat, elastic-agent and filebeat:
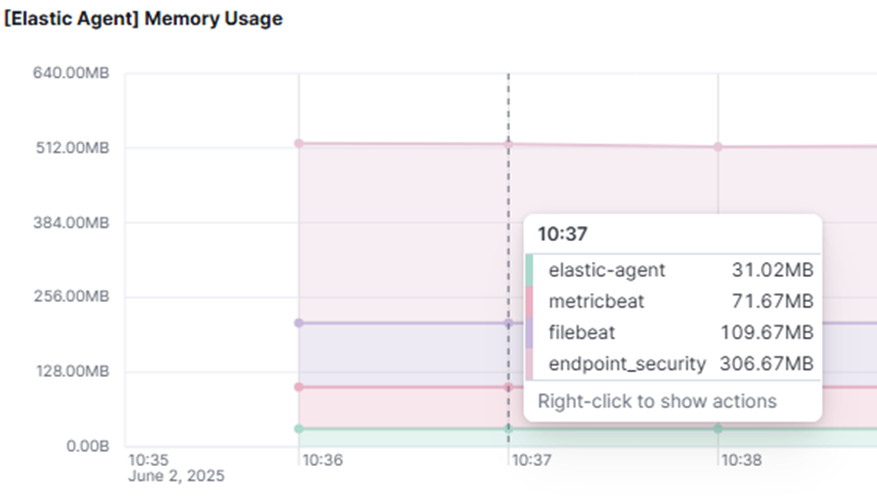
I’m not able to do a matching with the (corresponding?) processes on Windows nor can I figure out how the data has been calculated. Endpoint_security allegedly uses around 306.6 MB of RAM. Clearly the visualization above uses data stored in system.process.memory.size as APM System Metrics fields | APM Server Reference [7.2] | Elastic says about system.process.memory.size: “The total virtual memory the process has.” So I figured that has to be the “PrivateMemorySize” as those numbers match for at least the elastic-endpoint process:

321568768 = 306.6MB
But they don’t match in case of the elastic-agent process. According to the document with Timestamp 10:41, elastic-agent process memory usage is 31MB on size:

PrivateMemorySize: 37265408 Bytes => 35.5MB. I know it’s not much but why the difference?

As a last question I’m wondering whether there is a visualization for all the subprocesses of elas-tic-agent.exe which are primarily instances of agentbeat.exe? I’ve created my own Dashboard for the different processes representing the values of system.process.memory.size:

Initially I thought the 512MB in Printscreen 1 might be the added values of elastic-agent and it’s subprocesses of agentbeat, but they don’t match.

Those processes use around 437MB…
Thanks in advance for every answer and input from you guys!