Kibana version: 8.8.1
Elasticsearch version: 8.8.1
APM Server version: 8.8.1
APM Agent language and version: NodeJs Agent elastic-apm-node": "^3.47.0
Fresh install or upgraded from other version? Upgraded from 7.17 recently
Description of the problem including expected versus actual behavior. Please include screenshots (if relevant):
We have integrated elastic-apm-node for our express app and there are couple of issues we are facing with respect to transaction and logging.
1. Not able to create transaction for 1st request after deployment
Configuration:
const apm = require('elastic-apm-node').start({
  // Override the service name from package.json
  // Allowed characters: a-z, A-Z, 0-9, -, _, and space
  serviceName: 'forecast-service',

  // Use if APM Server requires a secret token
  secretToken: config.app.apmSecretToken,

  // Set the custom APM Server URL (default: http://localhost:8200)
  serverUrl: config.app.elasticApmUrl,
  // serverUrl: 'http://localhost:8200',
  ignoreUrls: ['/', '/metrics'],
  captureBody: 'transactions',
  logLevel: 'debug',
  apiRequestSize: '1mb',
  environment: config.config_id
});
Logs from deployment:
{"log.level":"info","@timestamp":"2023-07-05T09:26:32.711Z","log":{"logger":"elastic-apm-node"},"agentVersion":"3.47.0","env":{"pid":28342,"proctitle":"/Users/keshashah/.nvm/versions/node/v14.17.6/bin/node","os":"darwin 22.4.0","arch":"arm64","host":"MacBook-Pro.local","timezone":"UTC+0550","runtime":"Node.js v14.17.6"},"config":{"serviceName":{"source":"start","value":"forecast-service","commonName":"service_name"},"serviceVersion":{"source":"default","value":"1.0.0","commonName":"service_version"},"serverUrl":{"source":"start","value":"https://<apm_url>","commonName":"server_url"},"logLevel":{"source":"start","value":"debug","commonName":"log_level"},"secretToken":{"source":"start","value":"[REDACTED]","commonName":"secret_token"},"ignoreUrls":{"source":"start","sourceValue":["/","/metrics"]},"captureBody":{"source":"start","value":"transactions","commonName":"capture_body"},"apiRequestSize":{"source":"start","value":1048576,"sourceValue":"1mb"},"environment":{"source":"start","value":"development"}},"activationMethod":"require","ecs":{"version":"1.6.0"},"message":"Elastic APM Node.js Agent v3.47.0"}
{"log.level":"debug","@timestamp":"2023-07-05T09:26:32.720Z","log":{"logger":"elastic-apm-node"},"ecs":{"version":"1.6.0"},"message":"adding hook to Node.js module loader"}

{"message":"App is started successfully on port 5005","level":"info","label":"general-logger","timestamp":"2023-07-05T09:26:32.794Z","env":"development","source":"fasal-forecast-service","type":"app-log"}
{"log.level":"debug","@timestamp":"2023-07-05T09:26:32.840Z","log":{"logger":"elastic-apm-node"},"ecs":{"version":"1.6.0"},"message":"no cloud metadata servers responded"}
{"log.level":"debug","@timestamp":"2023-07-05T09:26:32.870Z","log":{"logger":"elastic-apm-node"},"remoteConf":{"transaction_max_spans":"10000"},"ecs":{"version":"1.6.0"},"message":"central config received"}
{"log.level":"info","@timestamp":"2023-07-05T09:26:32.870Z","log":{"logger":"elastic-apm-node"},"ecs":{"version":"1.6.0"},"message":"Central config success: updated transactionMaxSpans: 1000"}
{"log.level":"info","@timestamp":"2023-07-05T09:26:32.870Z","log":{"logger":"elastic-apm-node"},"ecs":{"version":"1.6.0"},"message":"Central config success: updated spanStackTraceMinDuration: -1"}
{"log.level":"debug","@timestamp":"2023-07-05T09:26:32.915Z","log":{"logger":"elastic-apm-node"},"event.module":"apmclient","apmServerVersion":"8.8.1","ecs":{"version":"1.6.0"},"message":"fetched APM Server version"}
After that when I call HTTP request for the first time, it tries to fetch modules but at the same time it does not intercept HTTP request hence no transactions gets created.
{"log.level":"debug","@timestamp":"2023-07-05T09:29:56.055Z","log":{"logger":"elastic-apm-node"},"ecs":{"version":"1.6.0"},"message":"shimming http@14.17.6 module"}
{"log.level":"debug","@timestamp":"2023-07-05T09:29:56.058Z","log":{"logger":"elastic-apm-node"},"ecs":{"version":"1.6.0"},"message":"shimming http.Server.prototype.emit function"}
{"log.level":"debug","@timestamp":"2023-07-05T09:29:56.058Z","log":{"logger":"elastic-apm-node"},"ecs":{"version":"1.6.0"},"message":"shimming http.ServerResponse.prototype.writeHead function"}
{"log.level":"debug","@timestamp":"2023-07-05T09:29:56.058Z","log":{"logger":"elastic-apm-node"},"ecs":{"version":"1.6.0"},"message":"shimming http.request function"}
{"log.level":"debug","@timestamp":"2023-07-05T09:29:56.058Z","log":{"logger":"elastic-apm-node"},"ecs":{"version":"1.6.0"},"message":"shimming http.get function"}
{"log.level":"debug","@timestamp":"2023-07-05T09:29:56.058Z","log":{"logger":"elastic-apm-node"},"ecs":{"version":"1.6.0"},"message":"shimming https@14.17.6 module"}
{"log.level":"debug","@timestamp":"2023-07-05T09:29:56.058Z","log":{"logger":"elastic-apm-node"},"ecs":{"version":"1.6.0"},"message":"shimming https.Server.prototype.emit function"}
{"log.level":"debug","@timestamp":"2023-07-05T09:29:56.059Z","log":{"logger":"elastic-apm-node"},"ecs":{"version":"1.6.0"},"message":"shimming https.request function"}
{"log.level":"debug","@timestamp":"2023-07-05T09:29:56.059Z","log":{"logger":"elastic-apm-node"},"ecs":{"version":"1.6.0"},"message":"shimming https.get function"}
{"log.level":"debug","@timestamp":"2023-07-05T09:29:56.230Z","log":{"logger":"elastic-apm-node"},"ecs":{"version":"1.6.0"},"message":"no active transaction found - cannot build new span"}
{"message":"adding post logs","level":"info","label":"forecast-api","timestamp":"2023-07-05T09:29:56.230Z","env":"development","source":"fasal-forecast-service","type":"app-log"}
{"log.level":"debug","@timestamp":"2023-07-05T09:29:56.230Z","log":{"logger":"elastic-apm-node"},"ecs":{"version":"1.6.0"},"message":"no active transaction found - cannot build new span"}
{"meta":{"req":{"url":"/v1/forecast","headers":{"content-type":"application/json","user-agent":"PostmanRuntime/7.29.2","accept":"*/*","postman-token":"6ed3a606-7757-44e1-a99e-905821afcc8d","host":"localhost:5005","accept-encoding":"gzip, deflate, br","connection":"keep-alive","content-length":"1037"},"method":"POST","httpVersion":"1.1","originalUrl":"/v1/forecast","query":{}},"res":{"statusCode":200},"responseTime":660},"level":"info","message":"HTTP POST /v1/forecast","label":"forecast-service","timestamp":"2023-07-05T09:29:56.424Z","env":"development","source":"fasal-forecast-service","type":"access-log"}
Now after first request all consecutive requests start working as in it intercept http request, build new transaction and send it to apm.
{"log.level":"debug","@timestamp":"2023-07-05T09:32:23.988Z","log":{"logger":"elastic-apm-node"},"ecs":{"version":"1.6.0"},"message":"intercepted request event call to http.Server.prototype.emit for /v1/forecast"}
{"log.level":"debug","@timestamp":"2023-07-05T09:32:23.990Z","log":{"logger":"elastic-apm-node"},"ecs":{"version":"1.6.0"},"message":"start trace {\"trans\":\"889e18774f73bba0\",\"trace\":\"076f69b436a94bb61407e9a5dc15096a\",\"name\":\"unnamed\",\"type\":\"custom\",\"subtype\":null,\"action\":null}"}
{"log.level":"debug","@timestamp":"2023-07-05T09:32:23.991Z","log":{"logger":"elastic-apm-node"},"ctxmgr":"AsyncLocalStorageRunContextManager( RunContext<Transaction(889e18, 'unnamed')> )","ecs":{"version":"1.6.0"},"message":"supersedeWithTransRunContext(<Trans 889e18774f73bba0>)"}
{"log.level":"debug","@timestamp":"2023-07-05T09:32:23.999Z","log":{"logger":"elastic-apm-node"},"ecs":{"version":"1.6.0"},"message":"start span {\"span\":\"5699f9d0ccdf83ba\",\"parent\":\"889e18774f73bba0\",\"trace\":\"076f69b436a94bb61407e9a5dc15096a\",\"name\":\"forecast-get\",\"type\":\"internal\",\"subtype\":null,\"action\":null}"}
{"log.level":"debug","@timestamp":"2023-07-05T09:32:23.999Z","log":{"logger":"elastic-apm-node"},"ctxmgr":"AsyncLocalStorageRunContextManager( RunContext<Transaction(889e18, 'POST unknown route (unnamed)'), [Span(5699f9, 'forecast-get')]> )","ecs":{"version":"1.6.0"},"message":"supersedeWithSpanRunContext(<Span 5699f9d0ccdf83ba>)"}

{"message":"adding post logs","level":"info","label":"forecast-api","timestamp":"2023-07-05T09:32:23.999Z","env":"development","source":"fasal-forecast-service","type":"app-log","transactionId":"889e18774f73bba0","traceId":"076f69b436a94bb61407e9a5dc15096a"}
{"log.level":"debug","@timestamp":"2023-07-05T09:32:24.000Z","log":{"logger":"elastic-apm-node"},"ecs":{"version":"1.6.0"},"message":"start span {\"span\":\"28b2c654f1a57e8c\",\"parent\":\"5699f9d0ccdf83ba\",\"trace\":\"076f69b436a94bb61407e9a5dc15096a\",\"name\":\"get-data-for-plot\",\"type\":\"db\",\"subtype\":\"mongodb\",\"action\":null}"}
{"log.level":"debug","@timestamp":"2023-07-05T09:32:24.000Z","log":{"logger":"elastic-apm-node"},"ctxmgr":"AsyncLocalStorageRunContextManager( RunContext<Transaction(889e18, 'POST unknown route (unnamed)'), [Span(5699f9, 'forecast-get'),Span(28b2c6, 'get-data-for-plot')]> )","ecs":{"version":"1.6.0"},"message":"supersedeWithSpanRunContext(<Span 28b2c654f1a57e8c>)"}
{"log.level":"debug","@timestamp":"2023-07-05T09:32:24.082Z","log":{"logger":"elastic-apm-node"},"ecs":{"version":"1.6.0"},"message":"ended span {\"span\":\"28b2c654f1a57e8c\",\"parent\":\"5699f9d0ccdf83ba\",\"trace\":\"076f69b436a94bb61407e9a5dc15096a\",\"name\":\"get-data-for-plot\",\"type\":\"db\",\"subtype\":\"mongodb\",\"action\":null}"}
{"log.level":"debug","@timestamp":"2023-07-05T09:32:24.082Z","log":{"logger":"elastic-apm-node"},"ctxmgr":"AsyncLocalStorageRunContextManager( RunContext<Transaction(889e18, 'POST unknown route (unnamed)'), [Span(5699f9, 'forecast-get')]> )","ecs":{"version":"1.6.0"},"message":"addEndedSpan(get-data-for-plot)"}
{"log.level":"debug","@timestamp":"2023-07-05T09:32:24.082Z","log":{"logger":"elastic-apm-node"},"ecs":{"version":"1.6.0"},"message":"encoding span {\"span\":\"28b2c654f1a57e8c\",\"parent\":\"5699f9d0ccdf83ba\",\"trace\":\"076f69b436a94bb61407e9a5dc15096a\",\"name\":\"get-data-for-plot\",\"type\":\"db\"}"}
{"log.level":"debug","@timestamp":"2023-07-05T09:32:24.082Z","log":{"logger":"elastic-apm-node"},"ecs":{"version":"1.6.0"},"message":"ended span {\"span\":\"5699f9d0ccdf83ba\",\"parent\":\"889e18774f73bba0\",\"trace\":\"076f69b436a94bb61407e9a5dc15096a\",\"name\":\"forecast-get\",\"type\":\"internal\",\"subtype\":null,\"action\":null}"}
{"log.level":"debug","@timestamp":"2023-07-05T09:32:24.083Z","log":{"logger":"elastic-apm-node"},"ctxmgr":"AsyncLocalStorageRunContextManager( RunContext<Transaction(889e18, 'POST unknown route (unnamed)'), [Span(28b2c6, 'get-data-for-plot', ended)]> )","ecs":{"version":"1.6.0"},"message":"addEndedSpan(forecast-get)"}
{"log.level":"debug","@timestamp":"2023-07-05T09:32:24.083Z","log":{"logger":"elastic-apm-node"},"ecs":{"version":"1.6.0"},"message":"encoding span {\"span\":\"5699f9d0ccdf83ba\",\"parent\":\"889e18774f73bba0\",\"trace\":\"076f69b436a94bb61407e9a5dc15096a\",\"name\":\"forecast-get\",\"type\":\"internal\"}"}
{"log.level":"debug","@timestamp":"2023-07-05T09:32:24.128Z","log":{"logger":"elastic-apm-node"},"ecs":{"version":"1.6.0"},"message":"setting transaction result {\"trans\":\"889e18774f73bba0\",\"trace\":\"076f69b436a94bb61407e9a5dc15096a\",\"result\":\"HTTP 2xx\"}"}
current transaction is trace.id=076f69b436a94bb61407e9a5dc15096a transaction.id=889e18774f73bba0
{"meta":{"req":{"url":"/v1/forecast","headers":{"content-type":"application/json","user-agent":"PostmanRuntime/7.29.2","accept":"*/*","postman-token":"655affb2-e7c8-4e6c-a005-7bda63959bf4","host":"localhost:5005","accept-encoding":"gzip, deflate, br","connection":"keep-alive","content-length":"1037"},"method":"POST","httpVersion":"1.1","originalUrl":"/v1/forecast","query":{}},"res":{"statusCode":200},"responseTime":136},"level":"info","message":"HTTP POST /v1/forecast","label":"forecast-service","timestamp":"2023-07-05T09:32:24.128Z","env":"development","source":"fasal-forecast-service","type":"access-log","transactionId":"889e18774f73bba0","traceId":"076f69b436a94bb61407e9a5dc15096a"}
{"log.level":"debug","@timestamp":"2023-07-05T09:32:24.129Z","log":{"logger":"elastic-apm-node"},"ecs":{"version":"1.6.0"},"message":"sending span {\"span\":\"28b2c654f1a57e8c\",\"parent\":\"5699f9d0ccdf83ba\",\"trace\":\"076f69b436a94bb61407e9a5dc15096a\",\"name\":\"get-data-for-plot\",\"type\":\"db\"}"}
{"log.level":"debug","@timestamp":"2023-07-05T09:32:24.129Z","log":{"logger":"elastic-apm-node"},"ecs":{"version":"1.6.0"},"message":"sending span {\"span\":\"5699f9d0ccdf83ba\",\"parent\":\"889e18774f73bba0\",\"trace\":\"076f69b436a94bb61407e9a5dc15096a\",\"name\":\"forecast-get\",\"type\":\"internal\"}"}
{"log.level":"debug","@timestamp":"2023-07-05T09:32:24.129Z","log":{"logger":"elastic-apm-node"},"ecs":{"version":"1.6.0"},"message":"setting default transaction name: POST /v1/forecast {\"trans\":\"889e18774f73bba0\",\"trace\":\"076f69b436a94bb61407e9a5dc15096a\"}"}
{"log.level":"debug","@timestamp":"2023-07-05T09:32:24.130Z","log":{"logger":"elastic-apm-node"},"ctxmgr":"AsyncLocalStorageRunContextManager( RunContext<> )","ecs":{"version":"1.6.0"},"message":"addEndedTransaction(POST /v1/forecast)"}
{"log.level":"debug","@timestamp":"2023-07-05T09:32:24.131Z","log":{"logger":"elastic-apm-node"},"ecs":{"version":"1.6.0"},"message":"sending transaction {\"trans\":\"889e18774f73bba0\",\"trace\":\"076f69b436a94bb61407e9a5dc15096a\"}"}
{"log.level":"debug","@timestamp":"2023-07-05T09:32:24.131Z","log":{"logger":"elastic-apm-node"},"trans":"889e18774f73bba0","name":"POST /v1/forecast","trace":"076f69b436a94bb61407e9a5dc15096a","type":"request","result":"HTTP 2xx","duration":140.037,"ecs":{"version":"1.6.0"},"message":"ended transaction"}
I have tried checking all debug logs, trace logs but not sure why this happens every time. Whenever I redeployed application again first request will not be traced.
2. APM Server transport error (502) : Multiple times randomly it gives below errors
{"log.level":"error","@timestamp":"2023-07-05T08:37:00.771Z","log":{"logger":"elastic-apm-node"},"ecs":{"version":"1.6.0"},"message":"APM Server transport error (502): Unexpected APM Server response\nPost \"https://172.22.11.174:18705/intake/v2/events\": use of closed network connection\n"}
{"log.level":"error","@timestamp":"2023-07-05T08:37:23.357Z","log":{"logger":"elastic-apm-node"},"ecs":{"version":"1.6.0"},"message":"APM Server transport error (503): Unexpected APM Server response when polling config\n{\"ok\":false,\"message\":\"The requested resource is currently unavailable.\"}\n"}
{"log.level":"error","@timestamp":"2023-07-05T08:37:30.770Z","log":{"logger":"elastic-apm-node"},"ecs":{"version":"1.6.0"},"message":"APM Server transport error (502): Unexpected APM Server response\n{\"ok\":false,\"message\":\"The instance rejected the connection.\"}\n"}```
Sometimes also below error
{"log.level":"error","@timestamp":"2023-07-05T08:12:59.574Z","log":{"logger":"elastic-apm-node"},"ecs":{"version":"1.6.0"},"message":"APM Server transport error (502): Unexpected APM Server response\nPost \"https://172.22.11.174:18705/intake/v2/events\": local error: tls: bad record MAC\n"}
From troubleshooting guide I have tried setting up span compression and request size but it did not help.
3. Application logs are not getting pushed to elastic apm logs from agent. (Only for express app)
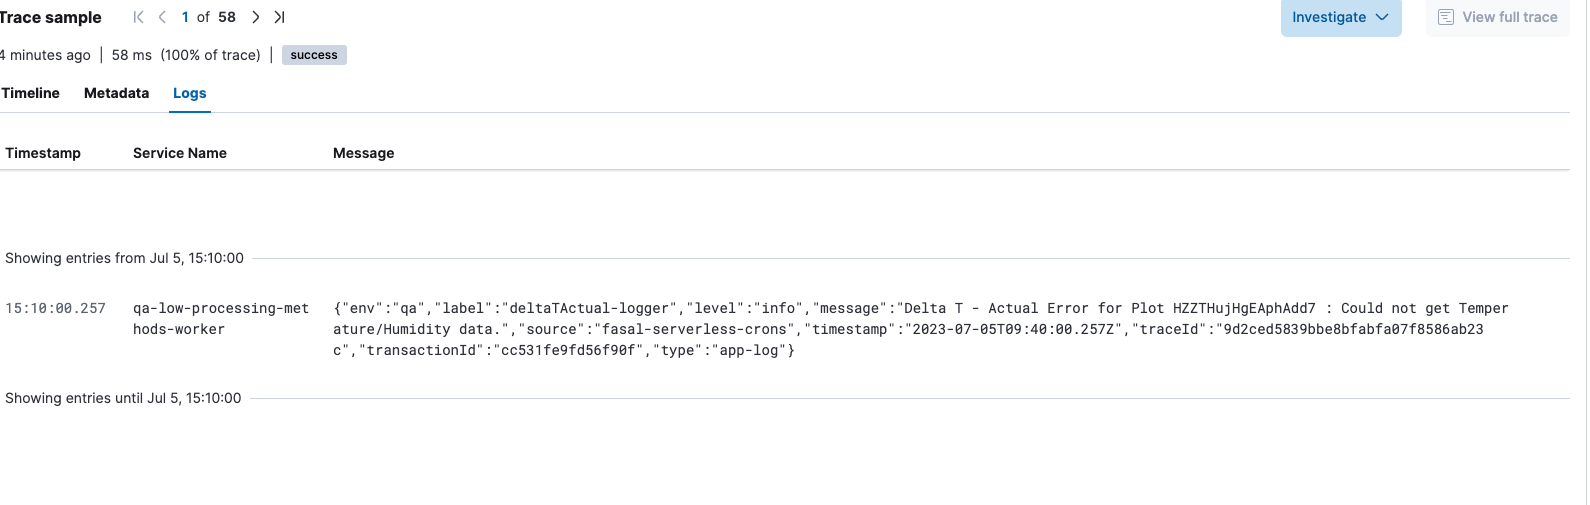
in our serverless lambda we have setup apm agent via serverless layer and that pushes all our logs to elastic under traces-apm logs as per screenshot below which also shows up in logs under apm logs tab, but same does not happen with our express app.
- Serverless Lambda logs coming up under traces-apm log

- In my express app it just pushes apm agent specific logs to Kibana and not application logs because of which we are not able to see logs in APM. (Please note in both applications all logs have transactionId and traceId)


although logs are coming under logs*

Please let me know if there is any specific configuration which I am missing to add logs to Kibana under "traces-apm", normal logs are coming fine under *logs type but that does not integrate with APM logs.
in normal setup all application logs get pushed to cloudwatch and from there we have one lambda which pushes to elastic logs. But above issue is specific to logs which are getting pushed to elastic directly from apm agent.