I've been playing around with Elastic Endpoint lately on my home Windows 10 pc, which has 4 CPU cores. I see that the elastic-endpoint.exe process is using around 24 % Normalized CPU:
I'd mostly say that one a Windows 10 PC I would expect the CPU usage to be lower, but looking at that graph seeing that Java process using ~25% CPU as well makes me wonder if endpoint is just spending those cycles monitoring what java is doing.
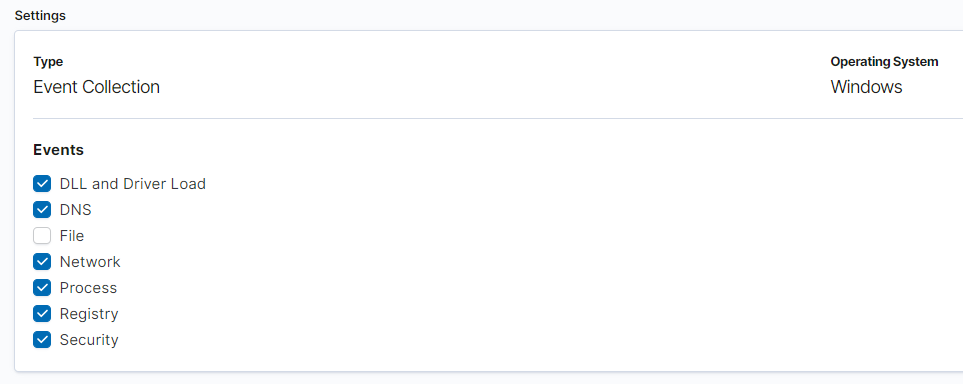
What is that java process? Does it do a lot of file IO? Can you share your endpoint policy config from Kibana so we can see what all the endpoint might be doing?
The java process is an elasticsearch node to which the endpoint is indexing. The node process is a Kibana process. On my phone now, ill post policy config later.
In that case, I believe there's a "feedback loop" of sorts happening where ES is writing to disk, Endpoint is sending the file write events to ES, and ES is writing them to disk. You could test this by turning off file events. The other option would be to add a trusted process entry for that java instance. Both of those are not ideal in production, but we're working on better solutions. Currently its not usually expected for the ES instance that Endpoint is sending data to be running on the same box.
Thanks for bringing it to our attention. Currently we'd only seen internal reports of this happening on linux hosts.
I was surprised I could only see hash and path as option to filter on? So this would mean all java.exe's on all endpoints are currently assumed trusted?
Checked the grap and it did not seem to have any effect. Is there anything else I need to do to push this to the Elastic Agent?
Only recently started playing with Lens. When I do sth similar with TSVB (Max Normalized CPU Usage By Process Name)
No change in CPU usage afterwards. But considering I might have misread the Lens graph, maybe this relatively shorter CPU spikes to 24 % are expected after all?
The weird thing is that when I am not using a filter on the endpoint process, the graph does dispaly the drops:
Apache, Apache Lucene, Apache Hadoop, Hadoop, HDFS and the yellow elephant
logo are trademarks of the
Apache Software Foundation
in the United States and/or other countries.