Lab 3.4 instructs to install version 4.9.0 of the APM RUM agent by running:
npm install @elastic/apm-rum@4.9.0 --save
After doing this and then applying the agent configuration as instructed in the lab I do receive the agent data in Kibana, however the Service Map has no connection between the RUM agent and the Node.js agent (marked with red cross):
The Petclinic application itself works fine as seen from my browser, so data is flowing from the React to the Node.js application.
I notice that the APM integration in Kibana has version 8.2.0 and the APM agent compatibility page says that for APM integration version >= 7.0 one needs to use a JavaScript RUM agent version 5.x, not 4.x.
So... can I fix this issue by upgrading the RUM agent to the latest version? (currently 5.12.0).
the issue is actually related to the way the load generator works, as most of the transactions are triggered from petclinic-node. After you interact with PetClinic in your browser you can narrow the time window with the time picker (e.g. Last 15 minutes) and you will probably get the proper service map. We will work to fix this in a next training release. Thanks for pointing this out.
I do have used the Petclinic GUI quite a lot and in this way generated traffic via the React component of the app. But still no connection in the Service Map and no transactions spanning from React onwards through Node.js and on.
I did have an issue initially with the petclinic-java component as I made a backup copy /root/start-scripts/50-petclinic-server.sh-20221022 of the /root/start-scripts/50-petclinic-server.sh file, not smart, as this resulted in two copies trying to start. So I deleted the backup file and restarted petclinc-java, after which it worked fine, also the Java agent.
This caused the RUM agent to send data before the Node.js agent did. Could this have caused the "missing link"?
And what about the compatibility page saying we need a 5.x RUM agent?
I zoomed in on the period of my own activity on the petclinic GUI, but still get the same result. Tried couple of times.
Trying to figure out in the traces-apm.rum-* datastreams what may be wrong. At least all event.outcome field values are "unknown"; for non-rum they are mostly "success". Docs here don't go into that detail, sigh...
I have run through all labs again up to and including the RUM agent config. I still get an isolated RUM agent in my service map. Done a lot of accesses on the Petclinic GUI, in Kibana APM selected just that timeframe and still get an isolated RUM agent. Tried other browser (Chrome instead of Firefox), tried Dynamic DNS name instead of public URL for apm_server_js param (but resolves to same IP, so indeed makes no difference).
Any suggestions are welcome. But I don't want to burn all my lab time on this topic, so I continue the labs.
disabling this filter also gives me agent.name:"js_base", which must be the RUM agent. Filtering on that agent, I only get the loadgen-related user agent, so no FireFox or Chrome:
So in all, the RUM agent just sees the loadgen traffic, whereas the other three agents see loadgen, FireFox and Chrome traffic. Could this be some browser security filter blocking JavaScript injection? (not sure if that happens at all here though).
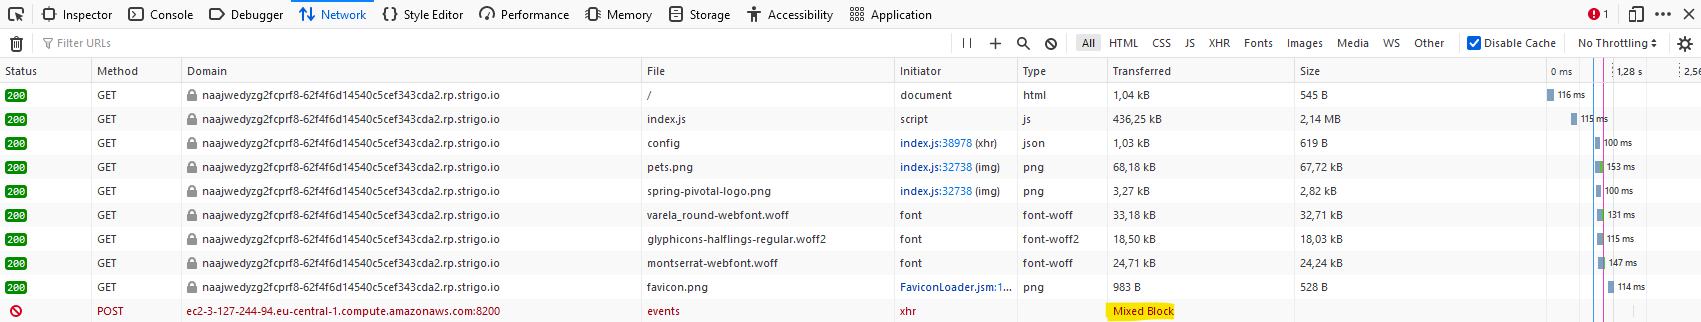
Got it! Should have remembered myself to check devtools. The agent was blocked due to a "mixed content" web page: the app itself is served over HTTPS, but the agent connects over HTTP. I got this:
The "[Learn More]" in the top screenshot leads to here. Since FireFox 23 mixed content is blocked, the page says. I see the protection can be manually switched off for the session duration:
After doing so, I indeed get the correct service map:
Apache, Apache Lucene, Apache Hadoop, Hadoop, HDFS and the yellow elephant
logo are trademarks of the
Apache Software Foundation
in the United States and/or other countries.