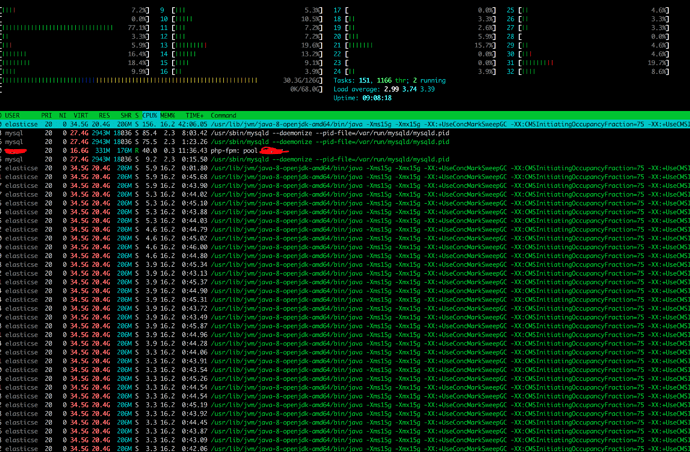
Hello. I am new to Elasticsearch. I use one installation on my server with version 6.8.5 for a magento 2 instance I have. I am using java-8-openjdk openjdk version "1.8.0_222". Although it not the first time I use the same setup now in my last scenario I have high load in cpus with was not there before. In peak it goes up to 4.00 with htop saying JAVA 400% cpu.
I am using jvm options:
-Xms15g
-Xmx15g
-XX:+UseConcMarkSweepGC
-XX:CMSInitiatingOccupancyFraction=75
-XX:+UseCMSInitiatingOccupancyOnly
-Des.networkaddress.cache.ttl=60
-Des.networkaddress.cache.negative.ttl=10
-XX:+AlwaysPreTouch
-Xss1m
-Djava.awt.headless=true
-Dfile.encoding=UTF-8
-Djna.nosys=true
-XX:-OmitStackTraceInFastThrow
-Dio.netty.noUnsafe=true
-Dio.netty.noKeySetOptimization=true
-Dio.netty.recycler.maxCapacityPerThread=0
-Dlog4j.shutdownHookEnabled=false
-Dlog4j2.disable.jmx=true
-Djava.io.tmpdir=${ES_TMPDIR}
-XX:+HeapDumpOnOutOfMemoryError
-XX:HeapDumpPath=/var/lib/elasticsearch
-XX:ErrorFile=/var/log/elasticsearch/hs_err_pid%p.log
8:-XX:+PrintGCDetails
8:-XX:+PrintGCDateStamps
8:-XX:+PrintTenuringDistribution
8:-XX:+PrintGCApplicationStoppedTime
8:-Xloggc:/var/log/elasticsearch/gc.log
8:-XX:+UseGCLogFileRotation
8:-XX:NumberOfGCLogFiles=32
8:-XX:GCLogFileSize=64m
9-:-Xlog:gc*,gc+age=trace,safepoint:file=/var/log/elasticsearch/gc.log:utctime,pid,tags:filecount=32,filesize=64m
9-:-Djava.locale.providers=COMPAT
10-:-XX:UseAVX=2
And elasticsearch.yml
indices.query.bool.max_clause_count: 10024
I have specify JAVA_HOME as elastic advice and I have no errors anywhere.
Maybe I should use other JDK version?
If someone could help me what to do will be much appreciated.
Thank you
