Hi team
I have a production use case where i have small index few hundred megabutes like 10k docs. i have setup where i have many replicas and but single shard.
The current bottleneck seems to be fetch phase of the query, the query executes in about 10-15ms , but the fetch phase of _id translation takes addition 30ms. when i am doing profile: true , i see the fetch phase of the query is much higher overhead , any idea how to optimize further.
i already have source:false , dont have any stored_fields or fields i access . i just want to retrieve docs that matches the query , as soon as the doc matches reach 4k-8k range the latency overhead is 30ms even if lucene query execution is < 10ms . Overall this is the Elasticsearch latency , we have coordinator node on same as data node , so we are not doing extra network hops as well , in our queries we also do preference=local
any ideas or recmmendations to bring donw latency to almost raw lucene query speed
Hello @prateekp
Welcome to the community!!
Could you please share what is the query which is executed ? As this will help the community to review & suggest if it can be improved.
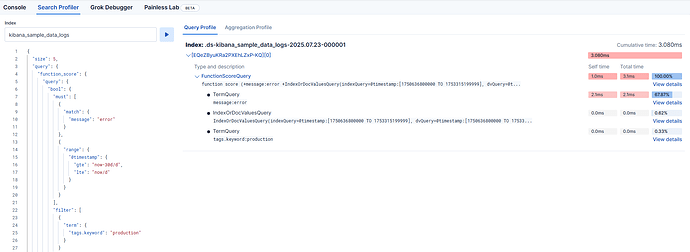
Also 1 way is to use profiler in kibana dev tools , to understand which part of query is taking more time for execution in order to see how that part can be improved?
Thanks!!
the query is internal query. The question is not regarding lucene query optimization. I am already doing what you suggested and figured lucene part is not the bottlneck , the fetch phase is teh bottleneck , not the UI you showes , thats for detailed profiling of lucene query . i am using the same kibana console to get metrics broken down though
example query
POST /index-name/_search?request_cache=false&preference=_local
{
"profile" : true,
"query": {
"bool": {
"filter": [
{
"terms": {
"format_id": [
4
]
}
},
{
"terms": {
"d_enum_ids": [
1,
2
]
}
},
{
"terms": {
"s_enum_ids": [
1,
5
]
}
},
{
"terms": {
"d_ids": [
1,
2
]
}
},
{
"range": {
"start_time_ms": {
"lte": 1752713100000
}
}
},
{
"range": {
"end_time_ms": {
"gte": 1752713100000
}
}
}
],
"must_not": [
{
"bool": {
"filter": [
{
"terms": {
"status_id": [
2,
3
]
}
},
{
"range": {
"effective_timestamp_ms": {
"gte": 1752713100000
}
}
}
]
}
}
]
}
},
"size": 4000,
"sort": [
{
"priority_id": {
"order": "asc"
}
},
{
"score": {
"order": "desc"
}
}
],
"_source": false
}
So you have 1 primary shard and a number of replicas that ensures all data nodes have a copy. Is that correct?
Is that index being actictively updated or modified? If so, can you try querying while pausing any modifications and see if that makes any difference?
Is this the only index in the cluster? If not, how much data does each data node hold and how much RAM and heap does each data node have?
If I remember correctly the local preference only applies to the node that receives the request and not multiple nodes located on the same host. I would therefore recommend trying to send requests directly to the data nodes and see if this makes a difference.
Could you elaborate a bit on why as well for me to understand the reason.
yes we have 1 shard and mamny replicas to handle high QPS , we have some writes, but that is not relevant as much and cant be changes based on update and freshness requirement , we are trying to reduce. The question here is not latency of the query (lucene) , but latency of the fetch phase , the id translation done after the query is done.
So the above recommendation are good for overall optimization , but i want to focus on a very specific fetch phase optimization not general guidelines on how to make query performant
btw , most of the testing and performance i am doing is for a somewhat n=static snapshot , its being updated but a very low write volume.
Which version of Elasticsearch are you using?
Did sending queries directly to data nodes make any difference?
we are using i think 8.6 . in our case coordinator and data nodes reside on same instance so yes we are directly sending query to data nodes ? or do you mean something else ?
Do you have dedicated coordinating nodes that do not hold any data? If you do, try bypassing these and send requests directly to the data nodes.
no we removed dedicated coordinating nodes, our coordinating nodes areon the datanode itself and hence we do preference_local to avoid any network hops , so we dsend queries directly to data nodes
The maybe unintended implication is that fetch cost isn’t growing as you’d expect? Is that correct?
Test and share how the query/fetch times compare as you grow the size parameter? Maybe run tests with that in 1k-10k range, in steps of 100 or 250, and graph the results.
not really, may be i oversimplified. For smaller topK , lucene query is dominating factor so our latencies are within 20ms and 8-12ms are lucence . But when i sweep over queries where i increase topK , i see increase (close to sub linear or sometimes linear when i siable caching
