Hello,
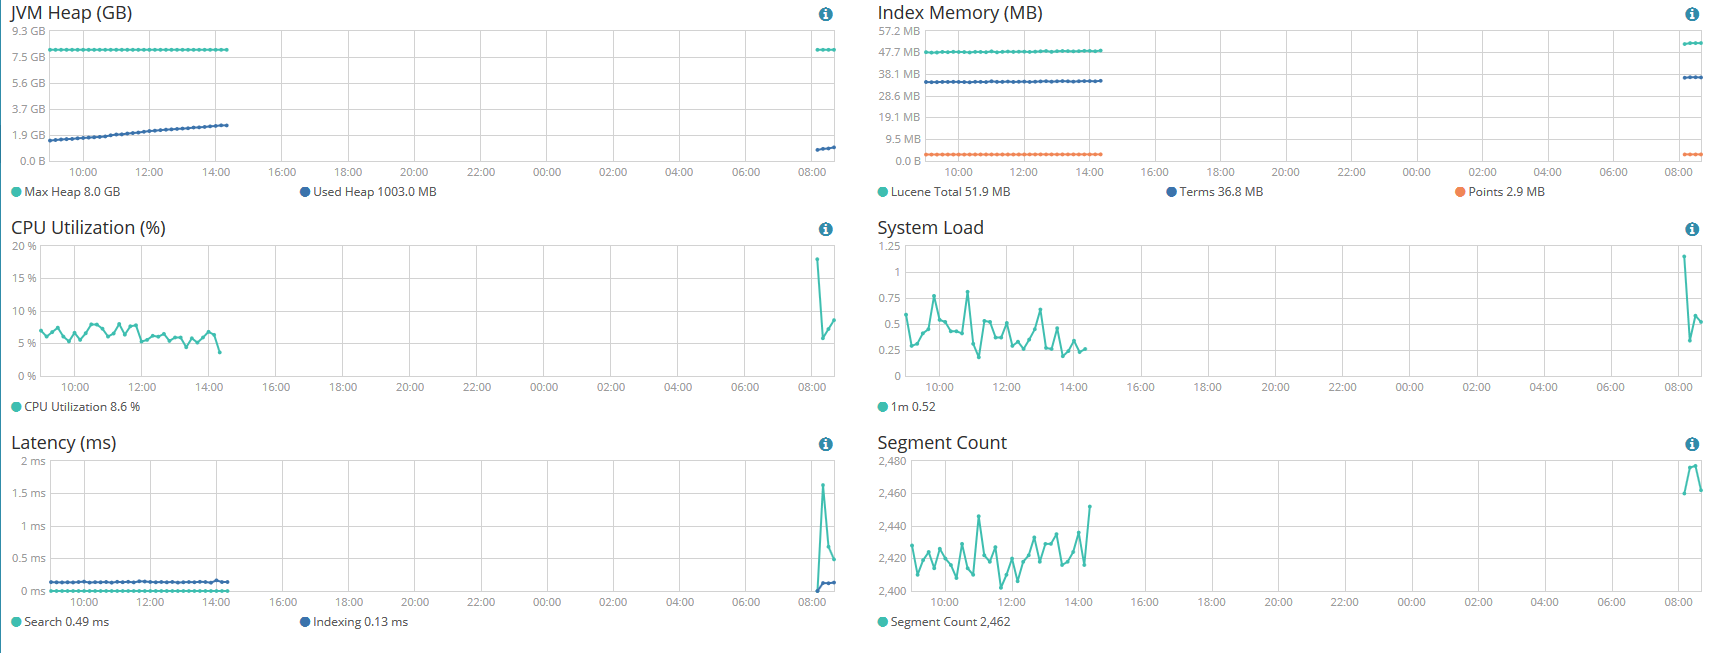
we are facing a strange issue regarding the stability of data nodes. Here is our architecture :
- 3 data nodes (master set to false ) ingesting data from logstash without any processing pipeline
- 1 master node ( data and ingest set to false )
The 4 of them are running on a RHEL 6 virtual machine with 4 vCPU and 16Gb RAM. Java has been updated to the recommended version and the elasticstack to the latest ( installed from yum) with the xpack plugin.
Note that is has been migrated from an ELK 2.4.1 which didn't have any stability issue.
from time to time, one of the data node just freeze without any error messages in the log:
[root@OPESHAS12 elasticsearch]# tail DataLake_ES-2017-03-12.log
[2017-03-12T14:23:54,346][DEBUG][o.e.i.f.p.ParentChildIndexFieldData] [aaa] [tomcat-logs-2017.03.12] global-ordinals [_parent] took [2.9micros]
[2017-03-12T14:24:04,297][DEBUG][o.e.x.m.e.l.LocalExporter] found index template [.monitoring-es-2] in version [2]
[2017-03-12T14:24:04,297][DEBUG][o.e.x.m.e.l.LocalExporter] found index template [.monitoring-kibana-2] in version [2]
[2017-03-12T14:24:04,297][DEBUG][o.e.x.m.e.l.LocalExporter] found index template [.monitoring-data-2] in version [2]
[2017-03-12T14:24:04,297][DEBUG][o.e.x.m.e.l.LocalExporter] found index template [.monitoring-logstash-2] in version [2]
the only error we got is comming from the master node :
[2017-03-12T07:40:05,764][INFO ][o.e.c.m.MetaDataMappingService] [MASTER_NODE] [apache-logs-2017.03.12/i6-kCJwXQieGOsedWJ-N6w] update_mapping [apache-accesslog]
[2017-03-12T14:24:41,977][DEBUG][o.e.a.a.c.n.s.TransportNodesStatsAction] [MASTER_NODE] failed to execute on node [VaXNp3oJToWgudn4VwJRRA]
org.elasticsearch.transport.ReceiveTimeoutTransportException: [DATA_NODE][192.168.82.162:9300][cluster:monitor/nodes/stats[n]] request_id [4855589] timed out after [
15000ms]
at org.elasticsearch.transport.TransportService$TimeoutHandler.run(TransportService.java:908) [elasticsearch-5.2.2.jar:5.2.2]
at org.elasticsearch.common.util.concurrent.ThreadContext$ContextPreservingRunnable.run(ThreadContext.java:527) [elasticsearch-5.2.2.jar:5.2.2]
at java.util.concurrent.ThreadPoolExecutor.runWorker(Unknown Source) [?:1.8.0_121]
at java.util.concurrent.ThreadPoolExecutor$Worker.run(Unknown Source) [?:1.8.0_121]
at java.lang.Thread.run(Unknown Source) [?:1.8.0_121]
[2017-03-12T14:24:41,978][WARN ][o.e.a.a.c.n.s.TransportNodesStatsAction] [MASTER_NODE] not accumulating exceptions, excluding exception from response
org.elasticsearch.action.FailedNodeException: Failed node [VaXNp3oJToWgudn4VwJRRA]
at org.elasticsearch.action.support.nodes.TransportNodesAction$AsyncAction.onFailure(TransportNodesAction.java:247) [elasticsearch-5.2.2.jar:5.2.2]
at org.elasticsearch.action.support.nodes.TransportNodesAction$AsyncAction.access$300(TransportNodesAction.java:160) [elasticsearch-5.2.2.jar:5.2.2]
...
at org.elasticsearch.common.util.concurrent.ThreadContext$ContextPreservingRunnable.run(ThreadContext.java:527) [elasticsearch-5.2.2.jar:5.2.2]
at java.util.concurrent.ThreadPoolExecutor.runWorker(Unknown Source) [?:1.8.0_121]
at java.util.concurrent.ThreadPoolExecutor$Worker.run(Unknown Source) [?:1.8.0_121]
at java.lang.Thread.run(Unknown Source) [?:1.8.0_121]
Caused by: org.elasticsearch.transport.ReceiveTimeoutTransportException: [DATA_NODE][192.168.82.162:9300][cluster:monitor/nodes/stats[n]] request_id [4855589] timed
out after [15000ms]
at org.elasticsearch.transport.TransportService$TimeoutHandler.run(TransportService.java:908) ~[elasticsearch-5.2.2.jar:5.2.2]
... 4 more
[2017-03-12T14:25:38,734][INFO ][o.e.c.r.a.AllocationService] [MASTER_NODE] Cluster health status changed from [GREEN] to [YELLOW] (reason: [{DATA_NODE}{VaXNp3oJToWgudn
4VwJRRA}{-q5t0yRXS5ys-BuiEC6QAg}{192.168.82.162}{192.168.82.162:9300} failed to ping, tried [3] times, each with maximum [30s] timeout]).
[2017-03-12T14:25:38,734][INFO ][o.e.c.s.ClusterService ] [MASTER_NODE] removed {{DATA_NODE}{VaXNp3oJToWgudn4VwJRRA}{-q5t0yRXS5ys-BuiEC6QAg}{192.168.82.162}{192.168.8
2.162:9300},}, reason: zen-disco-node-failed({DATA_NODE}{VaXNp3oJToWgudn4VwJRRA}{-q5t0yRXS5ys-BuiEC6QAg}{192.168.82.162}{192.168.82.162:9300}), reason(failed to ping
, tried [3] times, each with maximum [30s] timeout)[{DATA_NODE}{VaXNp3oJToWgudn4VwJRRA}{-q5t0yRXS5ys-BuiEC6QAg}{192.168.82.162}{192.168.82.162:9300} failed to ping,
tried [3] times, each with maximum [30s] timeout]
[2017-03-12T14:25:39,418][WARN ][o.e.c.a.s.ShardStateAction] [MASTER_NODE] [jboss-logs-2017.03.12][0] received shard failed for shard id [[jboss-logs-2017.03.12][0]], a
llocation id [Oozn33dlRESLthnS6WJklA], primary term [1], message [failed to perform indices:data/write/bulk[s] on replica [jboss-logs-2017.03.12][0], node[VaXNp3oJTo
Wgudn4VwJRRA], [R], s[STARTED], a[id=Oozn33dlRESLthnS6WJklA]], failure [NodeDisconnectedException[[DATA_NODE][192.168.82.162:9300][indices:data/write/bulk[s][r]] dis
connected]]
and so on :
[2017-03-12T14:25:41,210][INFO ][o.e.c.r.DelayedAllocationService] [MASTER_NODE] scheduling reroute for delayed shards in [57.4s] (425 delayed shards)
[2017-03-12T14:25:41,210][DEBUG][o.e.a.a.c.n.i.TransportNodesInfoAction] [MASTER_NODE] failed to execute on node [VaXNp3oJToWgudn4VwJRRA]
org.elasticsearch.transport.NodeDisconnectedException: [DATA_NODE][192.168.82.162:9300][cluster:monitor/nodes/info[n]] disconnected
...
[2017-03-12T14:25:41,211][DEBUG][o.e.a.a.i.s.TransportIndicesStatsAction] [MASTER_NODE] failed to execute [indices:monitor/stats] on node [VaXNp3oJToWgudn4VwJRRA]
org.elasticsearch.transport.NodeDisconnectedException: [DATA_NODE][192.168.82.162:9300][indices:monitor/stats[n]] disconnected
[2017-03-12T14:25:41,351][WARN ][o.e.c.a.s.ShardStateAction] [MASTER_NODE] [apache-logs-2017.03.12][2] received shard failed for shard id [[apache-logs-2017.03.12][2]],
allocation id [E7X2JD5lQTeSDOvHqTd9eA], primary term [1], message [mark copy as stale]
...
[2017-03-12T14:25:41,530][WARN ][o.e.c.a.s.ShardStateAction] [MASTER_NODE] [tomcat-logs-2017.03.12][0] received shard failed for shard id [[tomcat-logs-2017.03.12][0]],
allocation id [oD7fIyaiQuSIWO8JX99ZkA], primary term [1], message [mark copy as stale]
then the master node do some shard management and turn yellow to green.
System-wise, there isn't any error message in any system.log, messag, no file system full,...
the data nodes are set to debug tracing level.