Hi guys, everything ok?
I want to talk about a problem that we are facing with our ES cluster.
Today we have four machines in our cluster, each machine has 16GB of RAM
(8GB HEAP and 8GB OS).
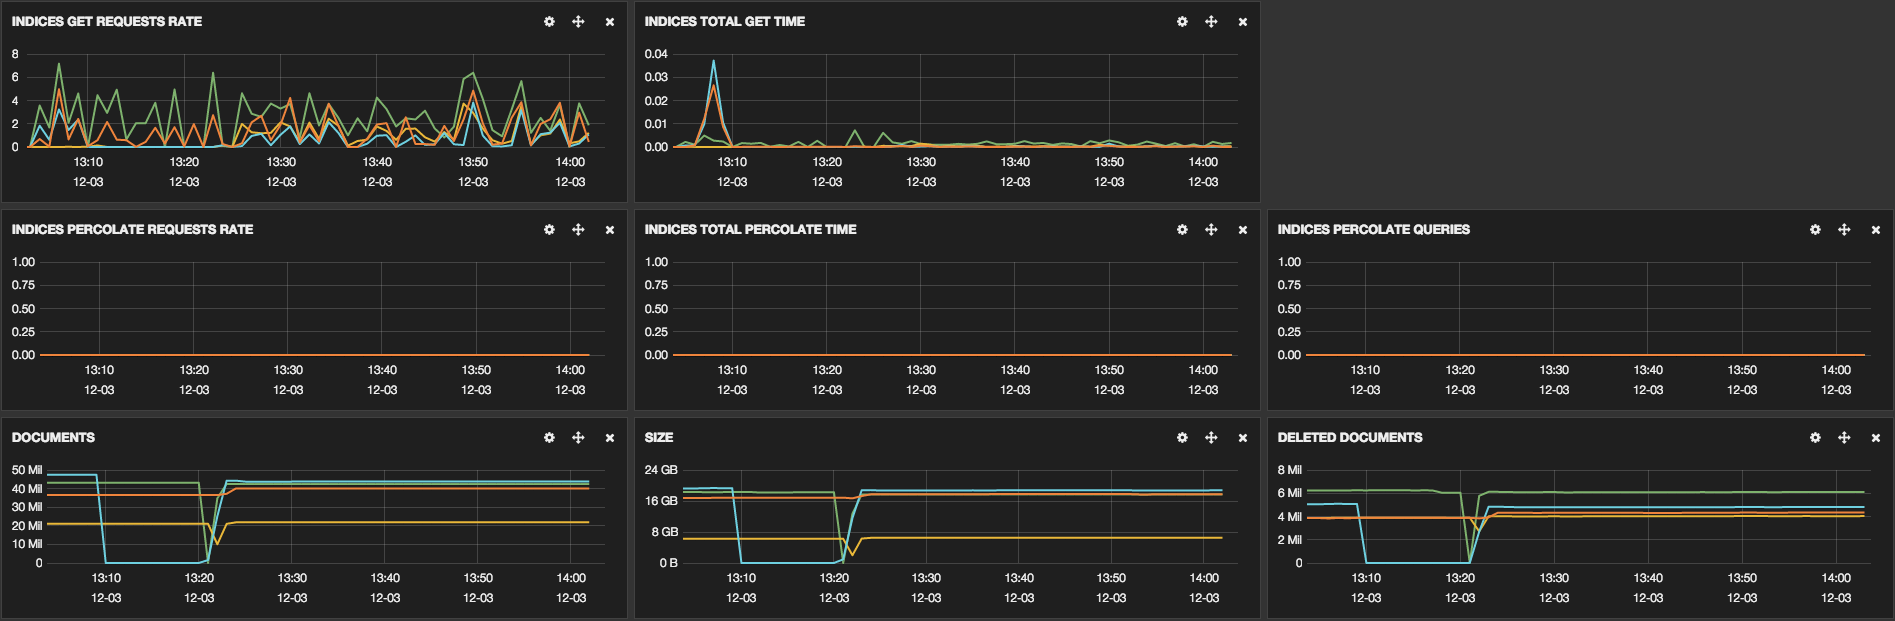
We have a total of 73,975,578 documents, 998 shards and 127 indices.
To index our docs we use the bulk API. Today our bulk request is made with
a total
up to 300 items. We put our docs in a queue so we can make the request in
the background.
The log below shows a piece of the information about the amount of
documents that was
sent for ES to index:
[2014-12-03 11:19:32 -0200] execute Event Create with 77 items in app 20
[2014-12-03 11:19:32 -0200] execute User Create with 1 items in app 67
[2014-12-03 11:19:40 -0200] execute User Create with 1 items in app 61
[2014-12-03 11:19:49 -0200] execute User Create with 1 items in app 62
[2014-12-03 11:19:50 -0200] execute User Create with 1 items in app 27
[2014-12-03 11:19:50 -0200] execute User Create with 2 items in app 20
[2014-12-03 11:19:54 -0200] execute User Create with 5 items in app 61
[2014-12-03 11:19:58 -0200] execute User Update with 61 items in app 20
[2014-12-03 11:20:02 -0200] execute User Create with 2 items in app 61
[2014-12-03 11:20:02 -0200] execute User Create with 1 items in app 27
[2014-12-03 11:20:10 -0200] execute User Create with 2 items in app 20
[2014-12-03 11:20:19 -0200] execute User Create with 5 items in app 61
[2014-12-03 11:20:20 -0200] execute User Create with 3 items in app 20
[2014-12-03 11:20:20 -0200] execute User Create with 1 items in app 24
[2014-12-03 11:20:25 -0200] execute User Create with 1 items in app 61
[2014-12-03 11:20:28 -0200] execute User Create with 1 items in app 20
[2014-12-03 11:20:37 -0200] execute Event Create with 91 items in app 20
[2014-12-03 11:20:42 -0200] execute User Create with 1 items in app 76
[2014-12-03 11:20:42 -0200] execute Event Create with 300 items in app 61
[2014-12-03 11:20:50 -0200] execute User Create with 4 items in app 61
[2014-12-03 11:20:51 -0200] execute User Create with 1 items in app 62
[2014-12-03 11:20:51 -0200] execute User Create with 2 items in app 20
[2014-12-03 11:20:55 -0200] execute User Create with 3 items in app 61
Sometimes the request occurs with just one item in the bulk. Another
interesting
thing is: we send that data frequently, in other words, the stress we put in
ES is pretty high.
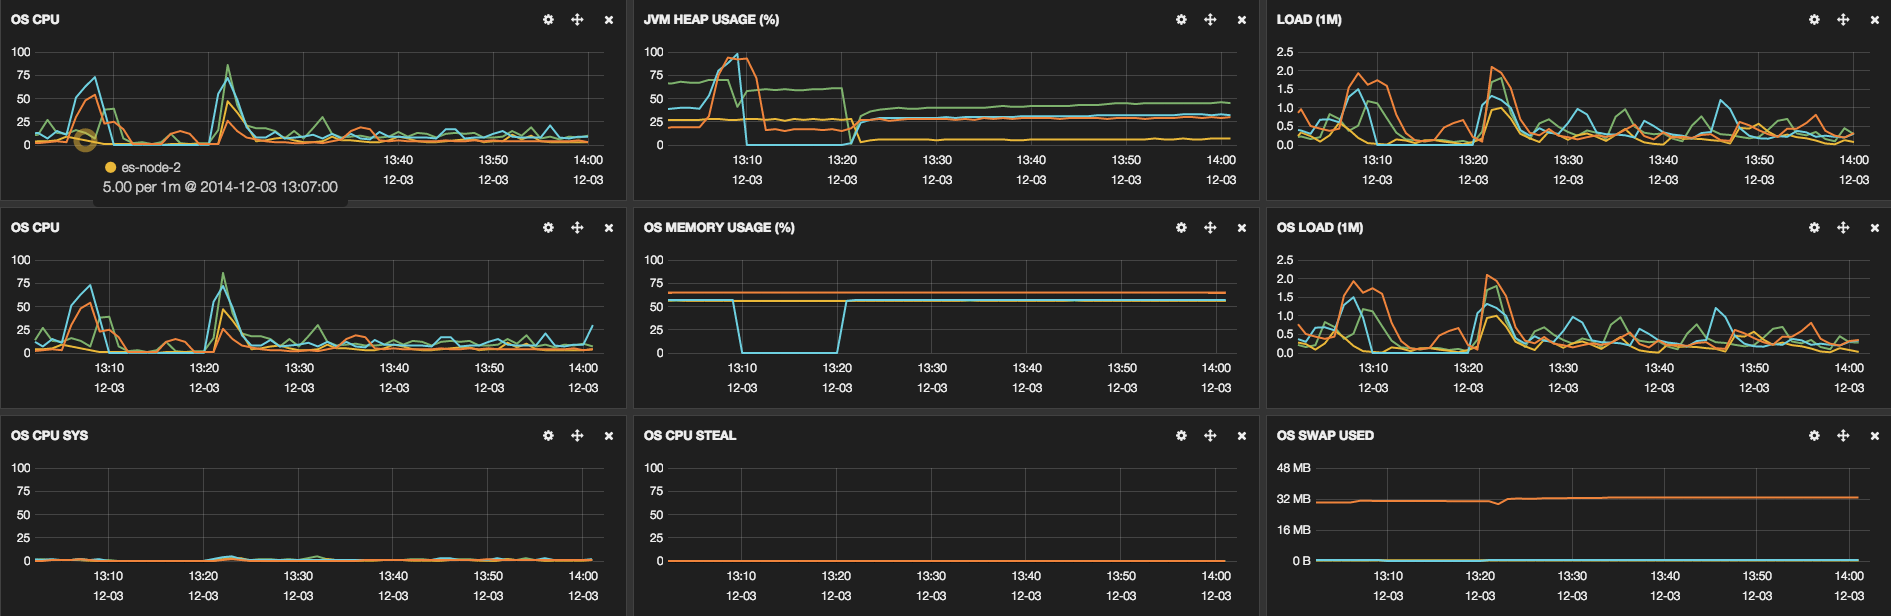
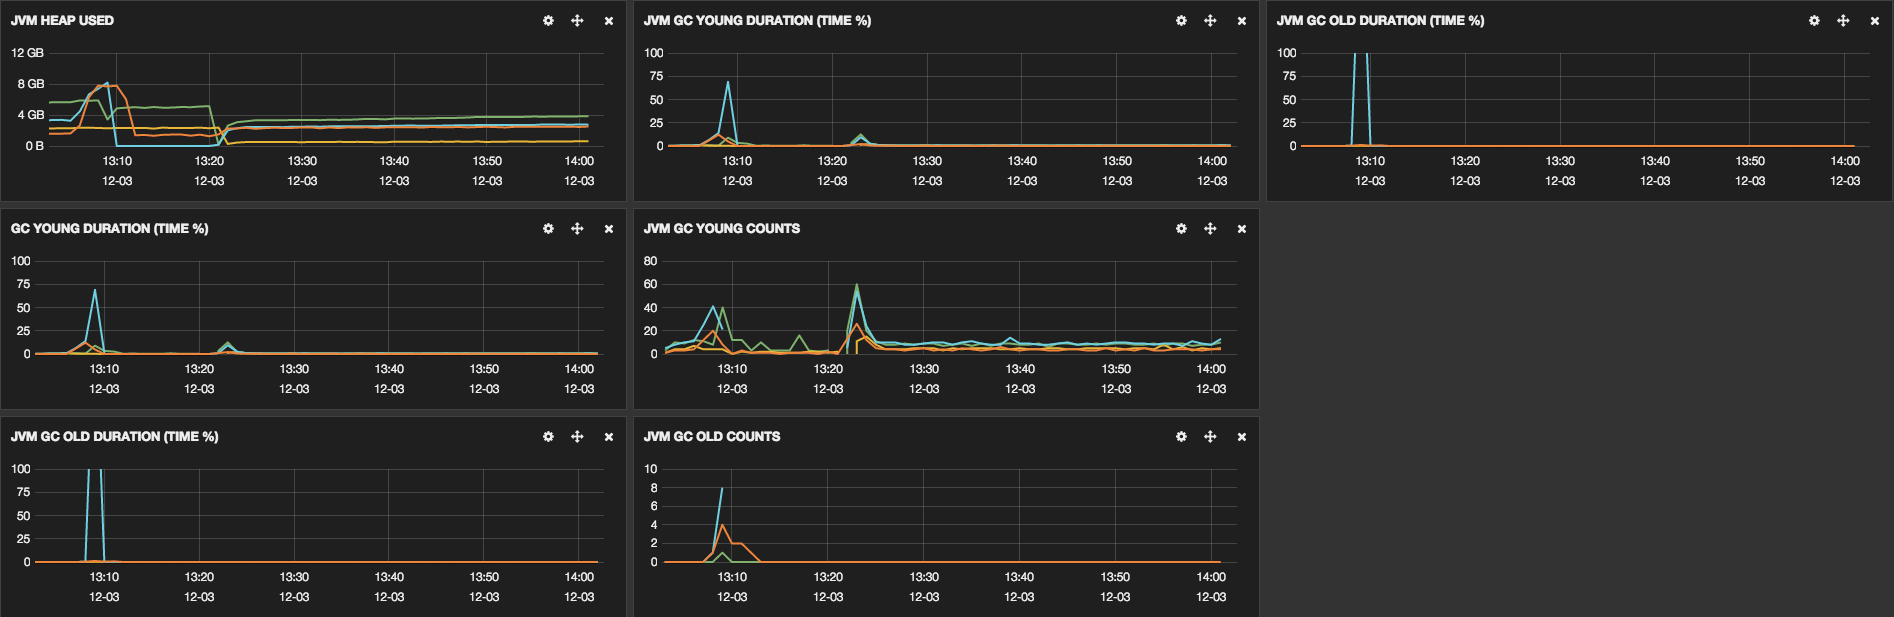
The big problem is when ES HEAP start approaching 75% of utilization and
the GC does not reach its normal value.
This log entrance show some GC working:
[2014-12-02 21:28:04,766][WARN ][monitor.jvm ] [es-node-2]
[gc][old][43249][56] duration [48s], collections [2]/[48.2s], total
[48s]/[17.9m], memory [8.2gb]->[8.3gb]/[8.3gb], all_pools {[young]
[199.6mb]->[199.6mb]/[199.6mb]}{[survivor]
[14.1mb]->[18.9mb]/[24.9mb]}{[old] [8gb]->[8gb]/[8gb]}
[2014-12-02 21:28:33,120][WARN ][monitor.jvm ] [es-node-2]
[gc][old][43250][57] duration [28.3s], collections [1]/[28.3s], total
[28.3s]/[18.4m], memory [8.3gb]->[8.3gb]/[8.3gb], all_pools {[young]
[199.6mb]->[199.6mb]/[199.6mb]}{[survivor]
[18.9mb]->[17.5mb]/[24.9mb]}{[old] [8gb]->[8gb]/[8gb]}
[2014-12-02 21:29:21,222][WARN ][monitor.jvm ] [es-node-2]
[gc][old][43251][59] duration [47.9s], collections [2]/[48.1s], total
[47.9s]/[19.2m], memory [8.3gb]->[8.3gb]/[8.3gb], all_pools {[young]
[199.6mb]->[199.6mb]/[199.6mb]}{[survivor]
[17.5mb]->[21.2mb]/[24.9mb]}{[old] [8gb]->[8gb]/[8gb]}
[2014-12-02 21:30:08,916][WARN ][monitor.jvm ] [es-node-2]
[gc][old][43252][61] duration [47.5s], collections [2]/[47.6s], total
[47.5s]/[20m], memory [8.3gb]->[8.3gb]/[8.3gb], all_pools {[young]
[199.6mb]->[199.6mb]/[199.6mb]}{[survivor]
[21.2mb]->[20.8mb]/[24.9mb]}{[old] [8gb]->[8gb]/[8gb]}
[2014-12-02 21:30:56,208][WARN ][monitor.jvm ] [es-node-2]
[gc][old][43253][63] duration [47.1s], collections [2]/[47.2s], total
[47.1s]/[20.7m], memory [8.3gb]->[8.3gb]/[8.3gb], all_pools {[young]
[199.6mb]->[199.6mb]/[199.6mb]}{[survivor]
[20.8mb]->[24.8mb]/[24.9mb]}{[old] [8gb]->[8gb]/[8gb]}
[2014-12-02 21:32:07,013][WARN ][transport ] [es-node-2]
Received response for a request that has timed out, sent [165744ms] ago,
timed out [8ms] ago, action [discovery/zen/fd/ping], node
[[es-node-1][sXwCdIhSRZKq7xZ6TAQiBg][localhost][inet[xxx.xxx.xxx.xxx/xxx.xxx.xxx.xxx:9300]]],
id [3002106]
[2014-12-02 21:36:41,880][WARN ][monitor.jvm ] [es-node-2]
[gc][old][43254][78] duration [5.7m], collections [15]/[5.7m], total
[5.7m]/[26.5m], memory [8.3gb]->[8.3gb]/[8.3gb], all_pools {[young]
[199.6mb]->[199.6mb]/[199.6mb]}{[survivor]
[24.8mb]->[24.4mb]/[24.9mb]}{[old] [8gb]->[8gb]/[8gb]}
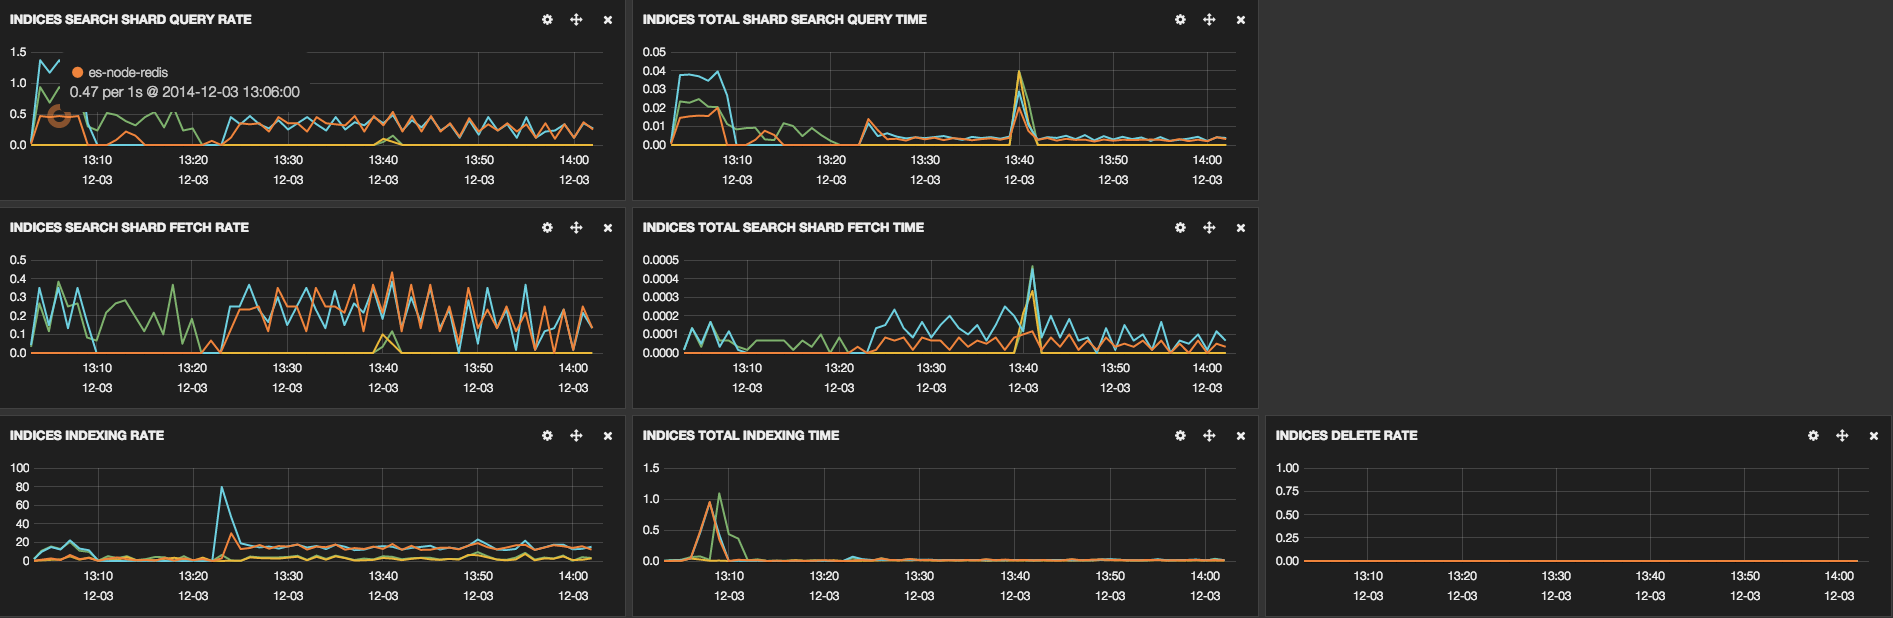
Another part that we use a lot is the ES search, these lines show some log
entrances that
were generated when the search was done
[2014-12-03 11:43:22 -0200] buscou pagina 1 de 111235 (10 por pagina) do
app 61
[2014-12-03 11:44:12 -0200] buscou pagina 1 de 30628 (10 por pagina) do app
5
[2014-12-03 11:44:13 -0200] buscou pagina 1 de 30628 (10 por pagina) do app
5
[2014-12-03 11:44:24 -0200] buscou pagina 1 de 63013 (10 por pagina) do app
20
[2014-12-03 11:44:24 -0200] buscou pagina 1 de 63013 (10 por pagina) do app
20
[2014-12-03 11:44:24 -0200] buscou pagina 1 de 63013 (10 por pagina) do app
20
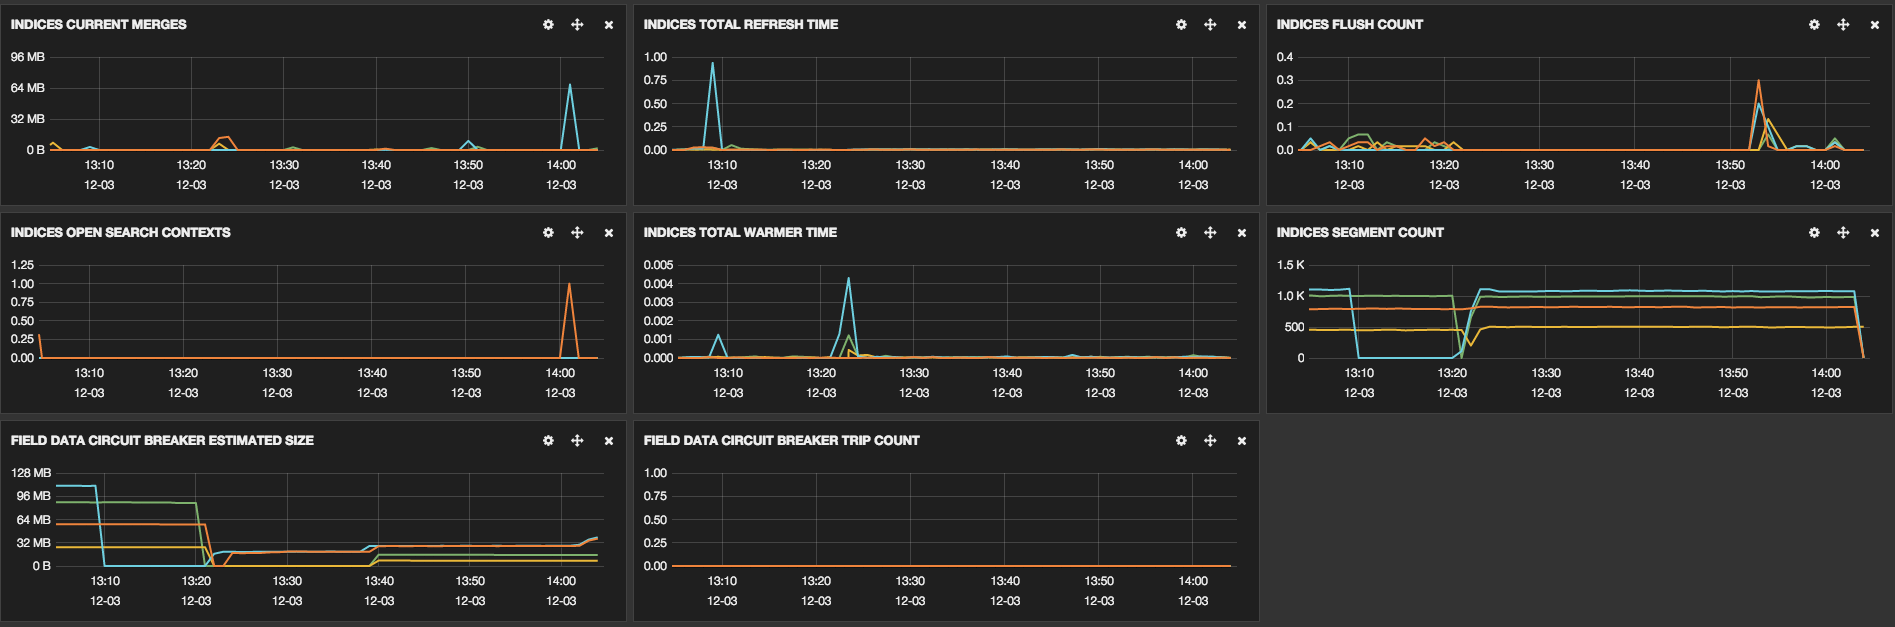
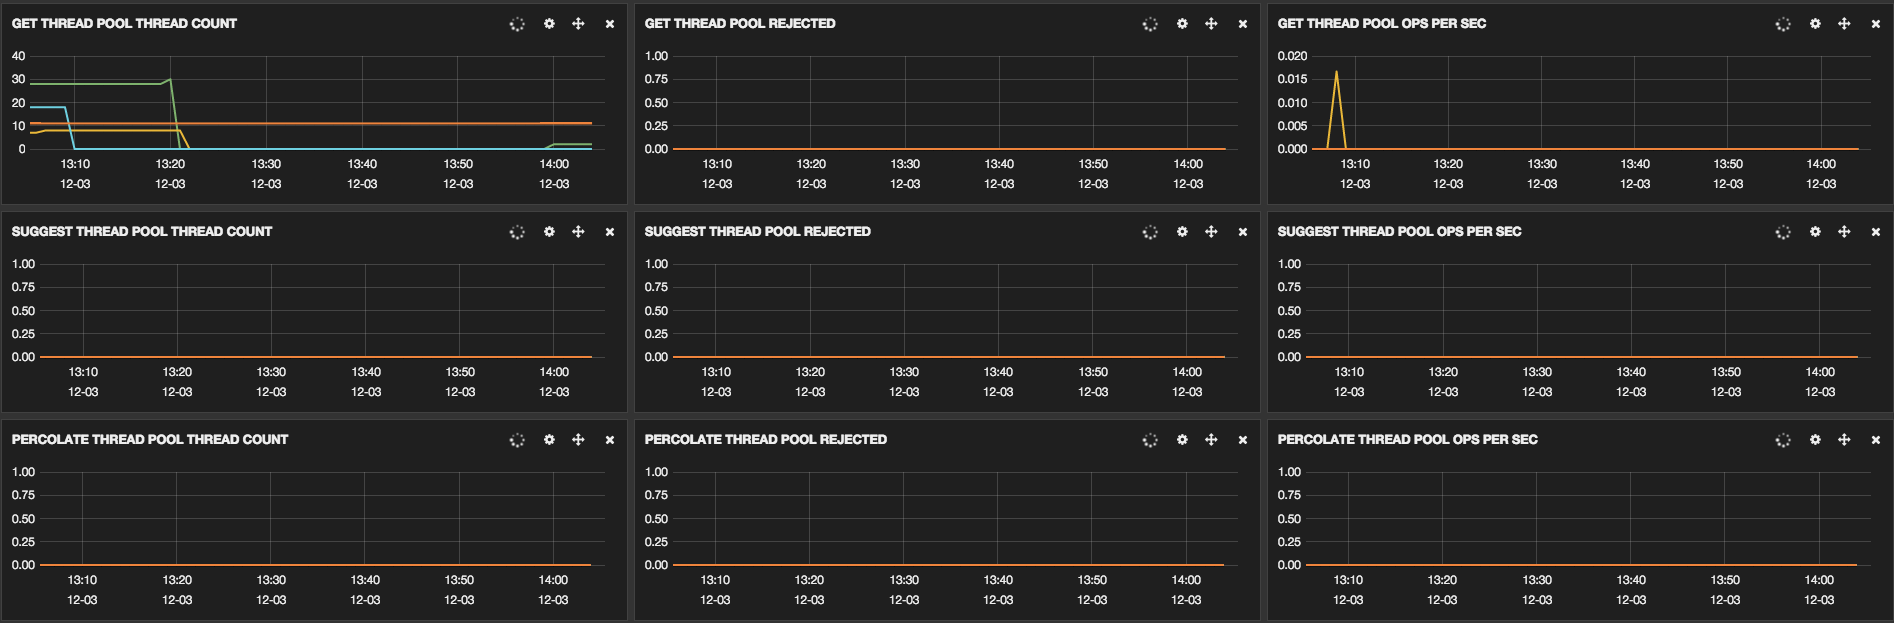
These links show some screenshots that were taken to show some cluster
information:
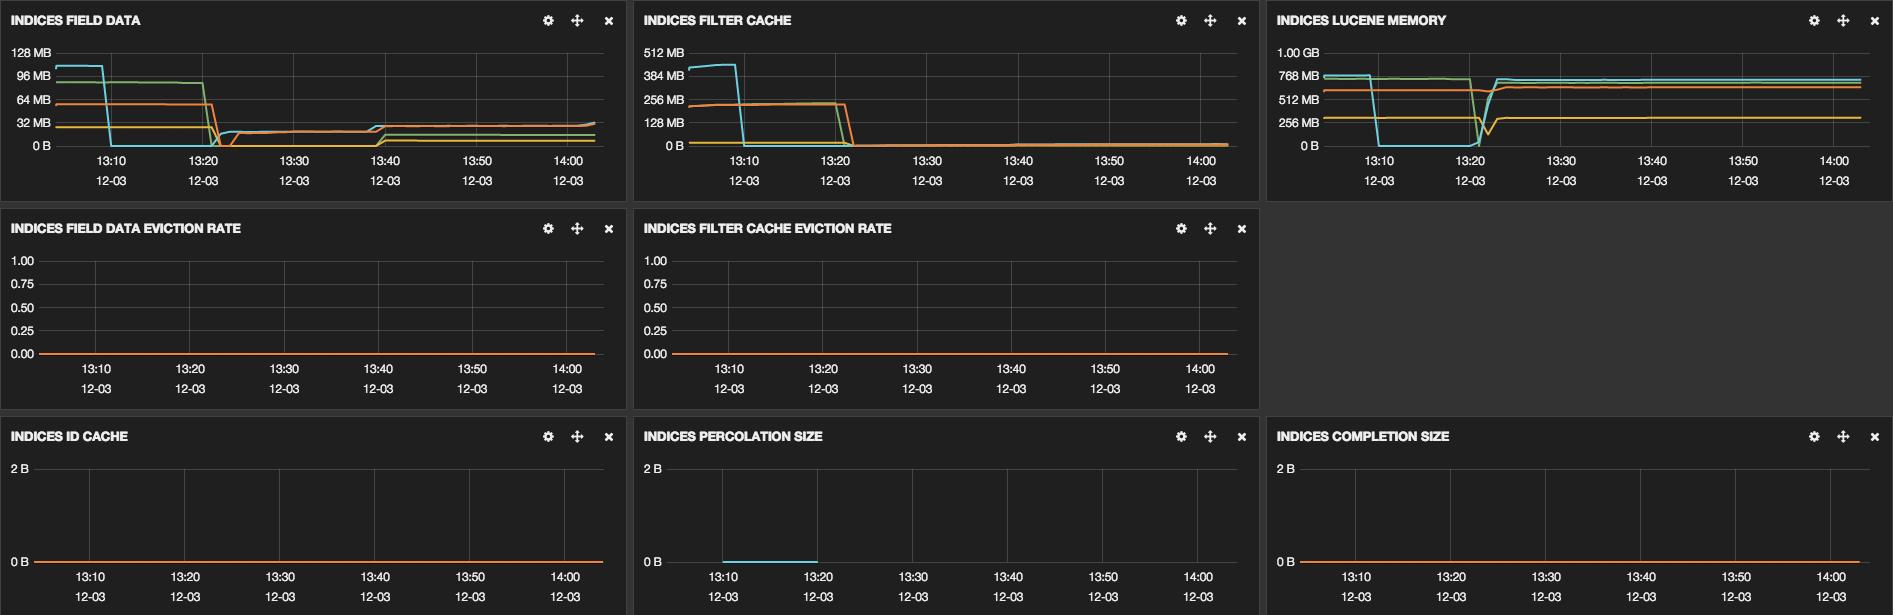
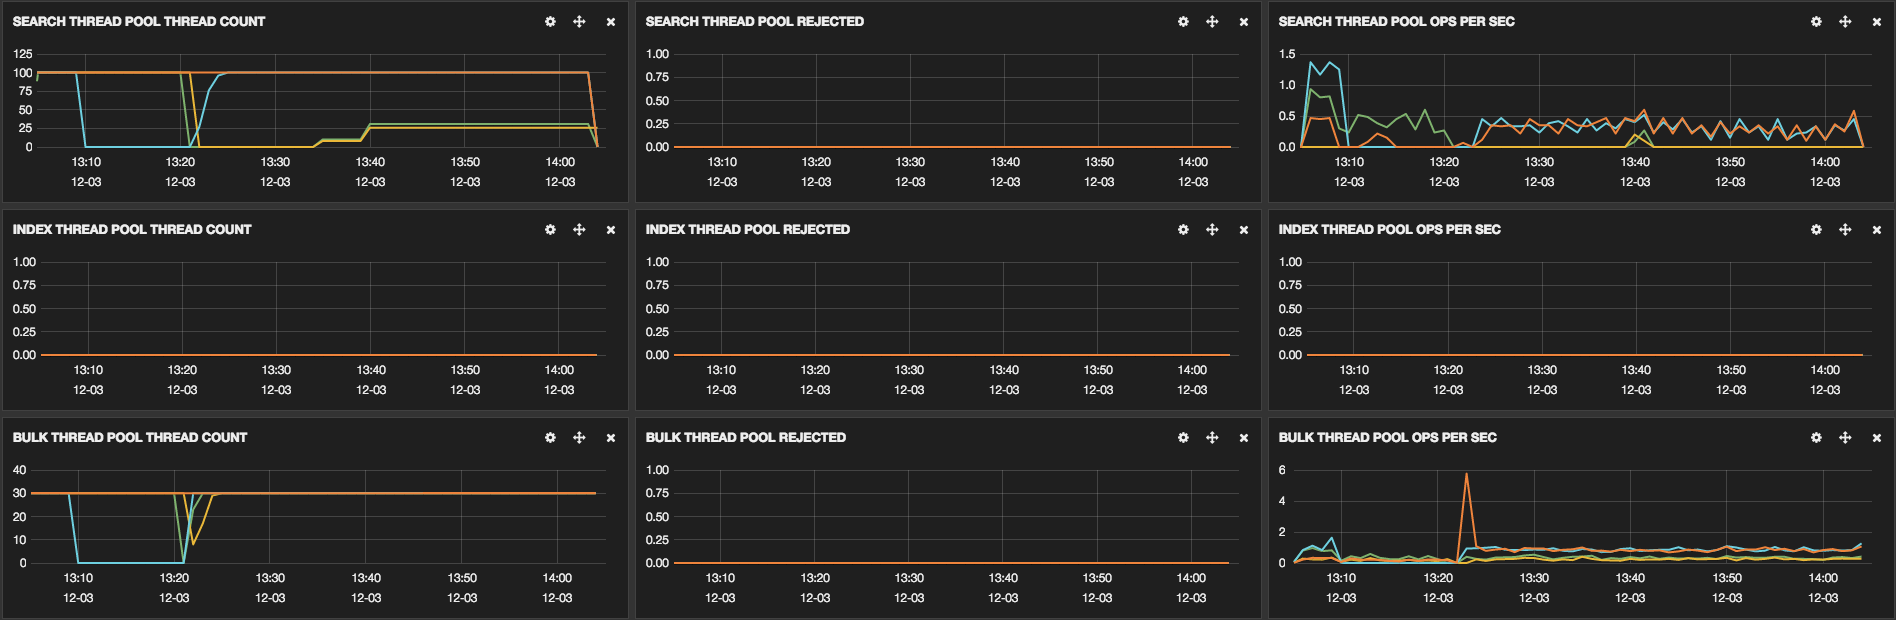
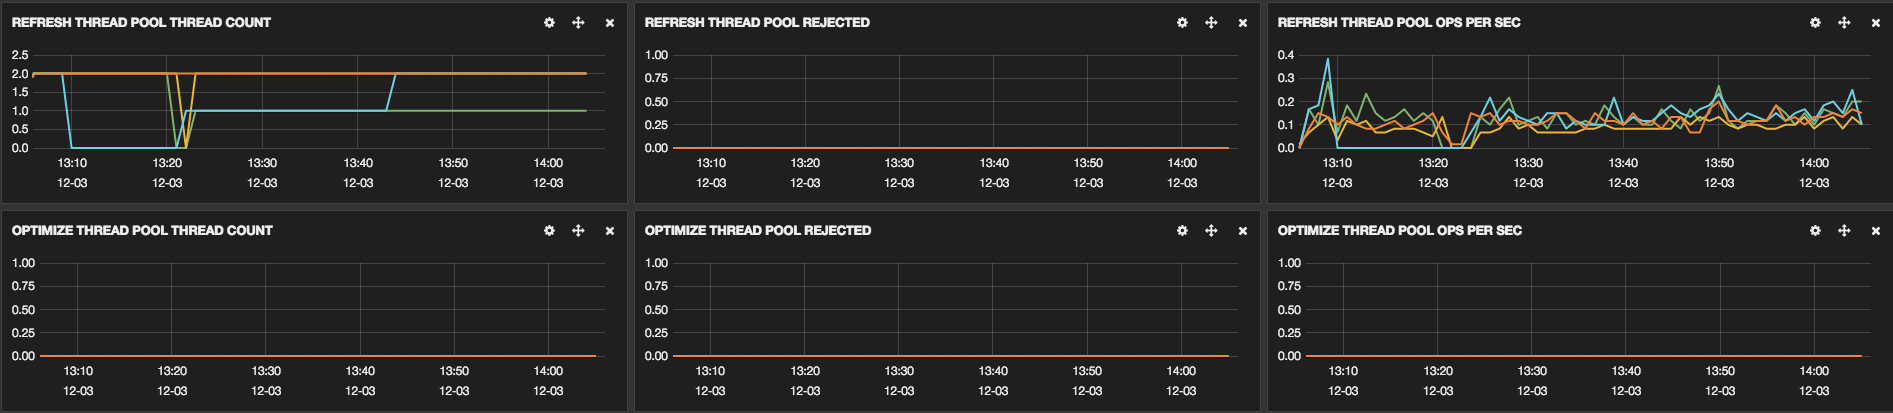
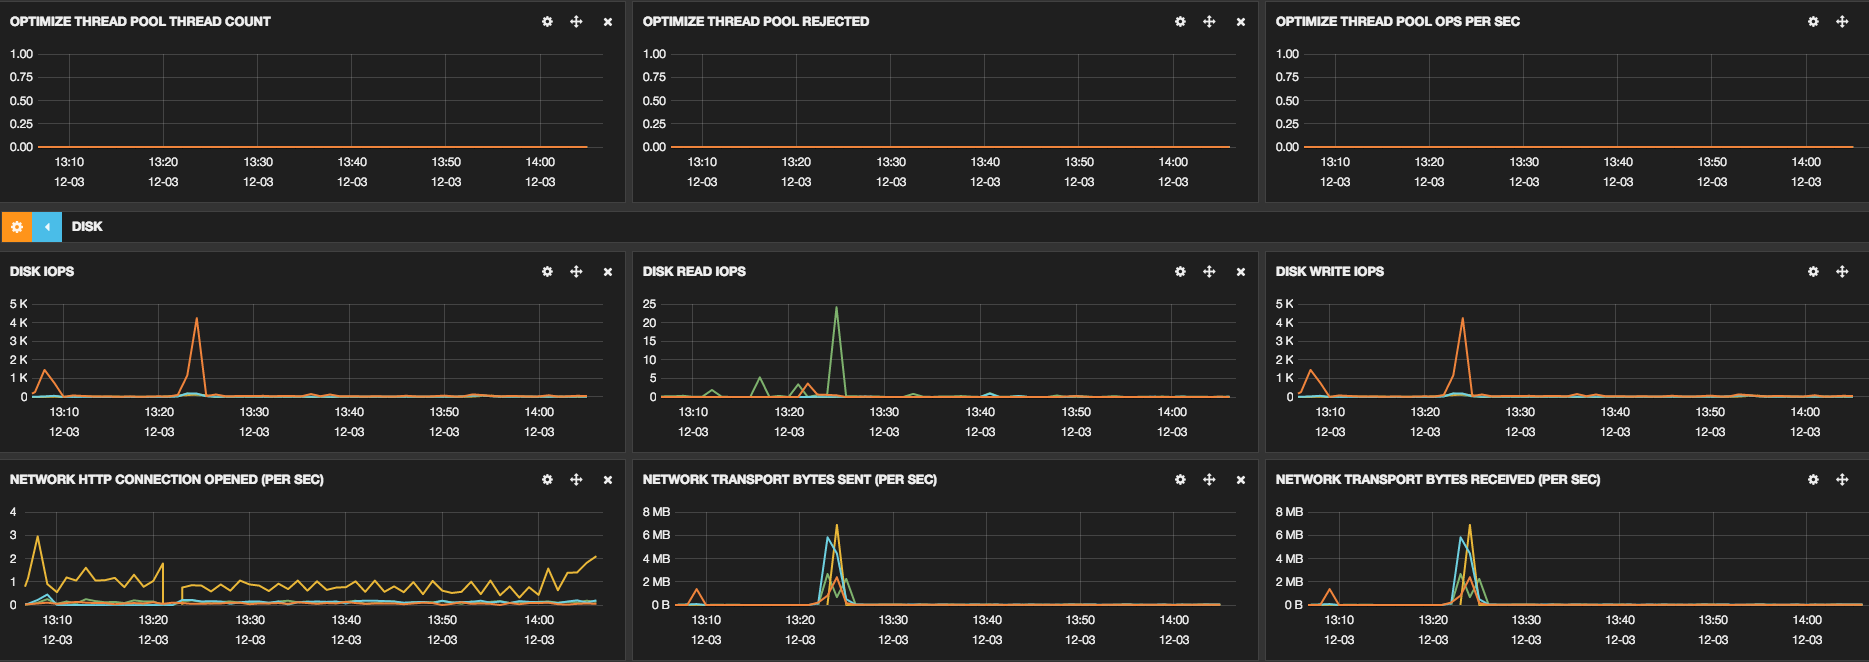
We have already optimized some parts, the configuration of our machines is:
threadpool.index.type: fixed
threadpool.index.size: 30
threadpool.index.queue_size: 1000
threadpool.bulk.type: fixed
threadpool.bulk.size: 30
threadpool.bulk.queue_size: 1000
threadpool.search.type: fixed
threadpool.search.size: 100
threadpool.search.queue_size: 200
threadpool.get.type: fixed
threadpool.get.size: 100
threadpool.get.queue_size: 200
index.merge.policy.max_merged_segment: 2g
index.merge.policy.segments_per_tier: 5
index.merge.policy.max_merge_at_once: 5
index.cache.field.type: soft
index.cache.field.expire: 1m
index.refresh_interval: 60s
bootstrap.mlockall: true
indices.memory.index_buffer_size: '15%'
discovery.zen.minimum_master_nodes: 3
discovery.zen.ping.multicast.enabled: false
discovery.zen.ping.unicast.hosts: ['xxx.xxx.xxx.xxx', 'xxx.xxx.xxx.xxx',
'xxx.xxx.xxx.xxx']
Our initial index process flows without any problem, the problems start to
happen after some days
of usage. Sometimes the cluster stays allright during 4 or 5 days and then
it shows some problems with
HEAP utilization. Are we missing any configuration or optimization?
--
You received this message because you are subscribed to the Google Groups "elasticsearch" group.
To unsubscribe from this group and stop receiving emails from it, send an email to elasticsearch+unsubscribe@googlegroups.com.
To view this discussion on the web visit https://groups.google.com/d/msgid/elasticsearch/987994d7-fd5a-440f-ab4a-225da155605a%40googlegroups.com.
For more options, visit https://groups.google.com/d/optout.