I'm running SugarCRM which uses Elasticsearch and i'm dealing with Elasticsearch crashing every week on my server. I did some digging and found some info online that talked about setting the heap size and various other memory settings for a server running CentOS. They didn't fix the problem.
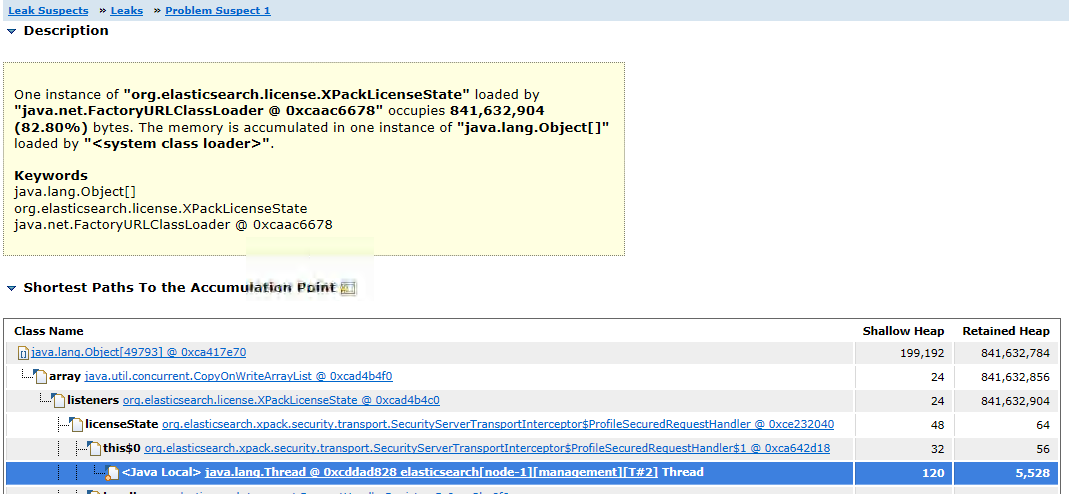
I'm at a point where I've now taken a heap dump file (.hprof) and run it through Eclipse Memory Analyzer but I have no experience in this area. Based on my limited knowledge of this subject it looks like the system is crashing because of XPackLicenseState... The heap dump "Leak Suspect" says the following:
`One instance of "org.elasticsearch.license.XPackLicenseState" loaded by "java.net.FactoryURLClassLoader @ 0xcaac6678" occupies 841,632,904 (82.80%) bytes. The memory is accumulated in one instance of "java.lang.Object[]" loaded by "<system class loader>"`

If I query for the license information I get the following:
{
  "license" : {
    "status" : "active",
    "uid" : "9f86080d-xxxx-xxxx-xxxx-xxxxxxxxxxxx", <--- redacted
    "type" : "basic",
    "issue_date" : "2018-12-28T21:29:07.850Z",
    "issue_date_in_millis" : 1546032547850,
    "max_nodes" : 1000,
    "issued_to" : "sugarcrm",
    "issuer" : "elasticsearch",
    "start_date_in_millis" : -1
  }
}
I am running Elasticsearch 6.4.2 on CentOS 7.
Elasticsearch was installed using RPM
Running as a single node right now
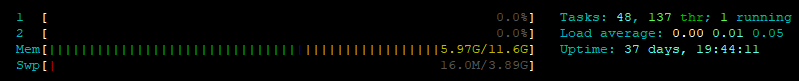
Server is assigned 12GB or RAM (it is a VM)
When it crashes, the following is written at the end of the log file:
[2019-03-03T20:03:47,789][ERROR][o.e.b.ElasticsearchUncaughtExceptionHandler] [node-1] fatal error in thread [elasticsearch[node-1][masterService#updateTask][T#1]], exiting
java.lang.OutOfMemoryError: Java heap space
        at java.util.Arrays.copyOf(Arrays.java:3181) ~[?:1.8.0_181]
        at java.util.concurrent.CopyOnWriteArrayList.add(CopyOnWriteArrayList.java:440) ~[?:1.8.0_181]
        at org.elasticsearch.license.XPackLicenseState.addListener(XPackLicenseState.java:307) ~[?:?]
        at org.elasticsearch.xpack.security.authz.accesscontrol.OptOutQueryCache.<init>(OptOutQueryCache.java:46) ~[?:?]
        at org.elasticsearch.xpack.security.Security.lambda$onIndexModule$15(Security.java:703) ~[?:?]
        at org.elasticsearch.xpack.security.Security$$Lambda$2704/418795023.apply(Unknown Source) ~[?:?]
        at org.elasticsearch.index.IndexModule.newIndexService(IndexModule.java:378) ~[elasticsearch-6.4.2.jar:6.4.2]
        at org.elasticsearch.indices.IndicesService.createIndexService(IndicesService.java:475) ~[elasticsearch-6.4.2.jar:6.4.2]
        at org.elasticsearch.indices.IndicesService.verifyIndexMetadata(IndicesService.java:547) ~[elasticsearch-6.4.2.jar:6.4.2]
        at org.elasticsearch.cluster.metadata.MetaDataUpdateSettingsService$1.execute(MetaDataUpdateSettingsService.java:199) ~[elasticsearch-6.4.2.jar:6.4.2]
        at org.elasticsearch.cluster.ClusterStateUpdateTask.execute(ClusterStateUpdateTask.java:45) ~[elasticsearch-6.4.2.jar:6.4.2]
        at org.elasticsearch.cluster.service.MasterService.executeTasks(MasterService.java:639) ~[elasticsearch-6.4.2.jar:6.4.2]
        at org.elasticsearch.cluster.service.MasterService.calculateTaskOutputs(MasterService.java:268) ~[elasticsearch-6.4.2.jar:6.4.2]
        at org.elasticsearch.cluster.service.MasterService.runTasks(MasterService.java:198) ~[elasticsearch-6.4.2.jar:6.4.2]
        at org.elasticsearch.cluster.service.MasterService$Batcher.run(MasterService.java:133) ~[elasticsearch-6.4.2.jar:6.4.2]
        at org.elasticsearch.cluster.service.TaskBatcher.runIfNotProcessed(TaskBatcher.java:150) ~[elasticsearch-6.4.2.jar:6.4.2]
        at org.elasticsearch.cluster.service.TaskBatcher$BatchedTask.run(TaskBatcher.java:188) ~[elasticsearch-6.4.2.jar:6.4.2]
        at org.elasticsearch.common.util.concurrent.ThreadContext$ContextPreservingRunnable.run(ThreadContext.java:624) ~[elasticsearch-6.4.2.jar:6.4.2]
        at org.elasticsearch.common.util.concurrent.PrioritizedEsThreadPoolExecutor$TieBreakingPrioritizedRunnable.runAndClean(PrioritizedEsThreadPoolExecutor.java:244) ~[elasticsearch-6.4.2.jar:6.4.2]
        at org.elasticsearch.common.util.concurrent.PrioritizedEsThreadPoolExecutor$TieBreakingPrioritizedRunnable.run(PrioritizedEsThreadPoolExecutor.java:207) ~[elasticsearch-6.4.2.jar:6.4.2]
        at java.util.concurrent.ThreadPoolExecutor.runWorker(ThreadPoolExecutor.java:1149) ~[?:1.8.0_181]
        at java.util.concurrent.ThreadPoolExecutor$Worker.run(ThreadPoolExecutor.java:624) ~[?:1.8.0_181]
        at java.lang.Thread.run(Thread.java:748) [?:1.8.0_181]
Right before the crash, i have a large amount of lines like this repeating:
[2019-03-03T20:01:04,696][WARN ][o.e.m.j.JvmGcMonitorService] [node-1] [gc][506867] overhead, spent [19s] collecting in the last [19s]
[2019-03-03T20:01:16,613][WARN ][o.e.m.j.JvmGcMonitorService] [node-1] [gc][old][506868][12652] duration [11.9s], collections [1]/[11.9s], total [11.9s]/[12.8h], memory [3.9gb]->[3.9gb]/[3.9gb], all_pools {[young] [133.1mb]->[133.1mb]/[1
33.1mb]}{[survivor] [15.6mb]->[15.7mb]/[16.6mb]}{[old] [3.8gb]->[3.8gb]/[3.8gb]}
[2019-03-03T20:01:16,614][WARN ][o.e.m.j.JvmGcMonitorService] [node-1] [gc][506868] overhead, spent [11.9s] collecting in the last [11.9s]
[2019-03-03T20:01:28,536][WARN ][o.e.m.j.JvmGcMonitorService] [node-1] [gc][old][506869][12653] duration [11.9s], collections [1]/[11.9s], total [11.9s]/[12.8h], memory [3.9gb]->[3.9gb]/[3.9gb], all_pools {[young] [133.1mb]->[133.1mb]/[1
33.1mb]}{[survivor] [15.7mb]->[15.8mb]/[16.6mb]}{[old] [3.8gb]->[3.8gb]/[3.8gb]}
[2019-03-03T20:01:28,536][WARN ][o.e.m.j.JvmGcMonitorService] [node-1] [gc][506869] overhead, spent [11.9s] collecting in the last [11.9s]
[2019-03-03T20:01:59,555][WARN ][o.e.m.j.JvmGcMonitorService] [node-1] [gc][old][506870][12655] duration [31s], collections [2]/[31s], total [31s]/[12.8h], memory [3.9gb]->[3.9gb]/[3.9gb], all_pools {[young] [133.1mb]->[133.1mb]/[133.1mb
]}{[survivor] [15.8mb]->[16.4mb]/[16.6mb]}{[old] [3.8gb]->[3.8gb]/[3.8gb]}
[2019-03-03T20:01:59,555][WARN ][o.e.m.j.JvmGcMonitorService] [node-1] [gc][506870] overhead, spent [31s] collecting in the last [31s]
[2019-03-03T20:03:14,971][WARN ][o.e.m.j.JvmGcMonitorService] [node-1] [gc][old][506871][12657] duration [30.6s], collections [2]/[30.6s], total [30.6s]/[12.8h], memory [3.9gb]->[3.9gb]/[3.9gb], all_pools {[young] [133.1mb]->[133.1mb]/[1
33.1mb]}{[survivor] [16.4mb]->[16.1mb]/[16.6mb]}{[old] [3.8gb]->[3.8gb]/[3.8gb]}
Any idea why things are crashing??? Is it a license thing or something else?