Elasticsearch global state file

Is there a way to store the Elasticsearch cluster global state file in a different directory then what is specified under the path.data variable?

The problem we are experience is in a hot/cold cluster. Hot nodes are all SSD storage, cold nodes are all SATA storage. After restarting a cold node and during the initialization of all the shards all of the cluster_state changes will start to timeout, though you can continue to query and read the cluster state without issue. This then leads Logstash to stop writing to Elasticsearch as soon as it tries to write a field mapping and receives a timeout message from the Elasticsearch cluster. The cluster continues to respond to any read/write request without issue, it is only the cluster state updates that time out.

Each cold node is 4 cores, 64GB RAM, 8TB SATA. CPU usage during shard initialization is <25% and the JVM heap (30GB) shows no issues. Everything is baremetal servers (not cloud) and everything is connected together at either 10Gb or 25Gb.

We believe we have traced this issue due to disk contention on the SATA disk. As it is initializing 8TB worth of shards the IO wait counters are high. Due to the SATA disk being thrashed for the shard initialization, any cluster state change that would be written to that same SATA disk times out. If we drop the 8 concurrent rebuilds to only 1 concurrent rebuilds it will alleviate this problem and the cluster state remains writable throughout the time-frame that the node is initializing its shards. The issue with this is the time it takes for the node to recover. 8 concurrent rebuilds will take 2 hours, 1 concurrent rebuild takes many times longer. Multiply that by 100 cold nodes.

This problem also only occurs when the cold (SATA) nodes are initializing shards. The SSD based nodes can be restarted in mass without there being any cluster state change timeouts.

Cluster is 150 nodes, 100 are cold and 50 are hot, 40k shards, 1k indices.

Any help, thoughts, experience, tips?

What version are you on?

6.7.1
Experienced the same problem on 6.6.1 and 6.5.4 as well.

Can we see the error message you're talking about, and the logs from around the same time (including stack traces)?

Logstash servers have a Elasticsearch client-only node installed locally, Logstash writes to localhost:9200.

These were the two repeating errors seen in Logstash. Each Logstash server is running 10+ pipelines, the pipelines would all continue to write to Elasticsearch until hitting the below 'put-mapping' error and then that one specific pipeline would stop as the others continued to write (different) logs to Elasticsearch without issue until hitting the same error. I checked the Elasticsearch thread queues and there was 0 write queue on all nodes.

Normal Elasticsearch write rate per pipeline is ~5k/s, overall Elasticsearch write rate averages 20-30k/s

{"level":"INFO","loggerName":"logstash.outputs.elasticsearch","timeMillis":1556767641632,"thread":"[winlogbeat]>worker1","logEvent":{"message":"retrying failed action with response code: 503 ({\"type\"=>\"process_cluster_event_timeout_exception\", \"reason\"=>\"failed to process cluster event (put-mapping) within 30s\"})"}}
{"level":"ERROR","loggerName":"logstash.outputs.elasticsearch","timeMillis":1556759281452,"thread":"[winlogbeat]>worker27","logEvent":{"message":"Attempted to send a bulk request to elasticsearch, but no there are no living connections in the connection pool. Perhaps Elasticsearch is unreachable or down?","error_message":"No Available connections","class":"LogStash::Outputs::ElasticSearch::HttpClient::Pool::NoConnectionAvailableError","will_retry_in_seconds":16}}

Sanitized Logstash output:

elasticsearch {
  hosts => [ "127.0.0.1" ]
  index => "winlogbeat-%{+YYYY.MM.dd}"
  manage_template => false
}

(hit per post character limit...)
Here is the error from Elasticsearch. This was on 6.6.1 before being upgraded to 6.7.1

[2019-05-01T15:29:32,002][ERROR][i.n.u.c.D.rejectedExecution] [logstash-es-01] Failed to submit a listener notification task. Event loop shut down?
java.util.concurrent.RejectedExecutionException: event executor terminated
        at io.netty.util.concurrent.SingleThreadEventExecutor.reject(SingleThreadEventExecutor.java:867) ~[?:?]
        at io.netty.util.concurrent.SingleThreadEventExecutor.offerTask(SingleThreadEventExecutor.java:328) ~[?:?]
        at io.netty.util.concurrent.SingleThreadEventExecutor.addTask(SingleThreadEventExecutor.java:321) ~[?:?]
        at io.netty.util.concurrent.SingleThreadEventExecutor.execute(SingleThreadEventExecutor.java:778) ~[?:?]
        at io.netty.util.concurrent.DefaultPromise.safeExecute(DefaultPromise.java:768) ~[?:?]
        at io.netty.util.concurrent.DefaultPromise.notifyListeners(DefaultPromise.java:432) ~[?:?]
        at io.netty.util.concurrent.DefaultPromise.setFailure(DefaultPromise.java:112) ~[?:?]
        at io.netty.channel.DefaultChannelPromise.setFailure(DefaultChannelPromise.java:89) ~[?:?]
        at io.netty.channel.AbstractChannelHandlerContext.safeExecute(AbstractChannelHandlerContext.java:1017) ~[?:?]
        at io.netty.channel.AbstractChannelHandlerContext.write(AbstractChannelHandlerContext.java:825) ~[?:?]
        at io.netty.channel.AbstractChannelHandlerContext.writeAndFlush(AbstractChannelHandlerContext.java:794) ~[?:?]
        at io.netty.channel.DefaultChannelPipeline.writeAndFlush(DefaultChannelPipeline.java:1066) ~[?:?]
        at io.netty.channel.AbstractChannel.writeAndFlush(AbstractChannel.java:309) ~[?:?]
        at org.elasticsearch.http.netty4.Netty4HttpChannel.sendResponse(Netty4HttpChannel.java:146) ~[?:?]
        at org.elasticsearch.rest.RestController$ResourceHandlingHttpChannel.sendResponse(RestController.java:497) ~[elasticsearch-6.6.1.jar:6.6.1]
        at org.elasticsearch.rest.action.RestResponseListener.processResponse(RestResponseListener.java:37) ~[elasticsearch-6.6.1.jar:6.6.1]
        at org.elasticsearch.rest.action.RestActionListener.onResponse(RestActionListener.java:47) ~[elasticsearch-6.6.1.jar:6.6.1]
        at org.elasticsearch.action.support.TransportAction$1.onResponse(TransportAction.java:85) ~[elasticsearch-6.6.1.jar:6.6.1]
        at org.elasticsearch.action.support.TransportAction$1.onResponse(TransportAction.java:81) ~[elasticsearch-6.6.1.jar:6.6.1]
        at org.elasticsearch.action.bulk.TransportBulkAction$BulkOperation$1.finishHim(TransportBulkAction.java:450) ~[elasticsearch-6.6.1.jar:6.6.1]
        at org.elasticsearch.action.bulk.TransportBulkAction$BulkOperation$1.onFailure(TransportBulkAction.java:445) ~[elasticsearch-6.6.1.jar:6.6.1]
        at org.elasticsearch.action.support.TransportAction$1.onFailure(TransportAction.java:91) ~[elasticsearch-6.6.1.jar:6.6.1]
        at org.elasticsearch.action.support.replication.TransportReplicationAction$ReroutePhase.finishAsFailed(TransportReplicationAction.java:946) ~[elasticsearch-6.6.1.jar:6.6.1]
        at org.elasticsearch.action.support.replication.TransportReplicationAction$ReroutePhase.retry(TransportReplicationAction.java:918) ~[elasticsearch-6.6.1.jar:6.6.1]
        at org.elasticsearch.action.support.replication.TransportReplicationAction$ReroutePhase$1.handleException(TransportReplicationAction.java:902) ~[elasticsearch-6.6.1.jar:6.6.1]
        at org.elasticsearch.transport.TransportService.sendRequest(TransportService.java:533) ~[elasticsearch-6.6.1.jar:6.6.1]
        at org.elasticsearch.action.support.replication.TransportReplicationAction$ReroutePhase.performAction(TransportReplicationAction.java:873) ~[elasticsearch-6.6.1.jar:6.6.1]
        at org.elasticsearch.action.support.replication.TransportReplicationAction$ReroutePhase.performRemoteAction(TransportReplicationAction.java:847) ~[elasticsearch-6.6.1.jar:6.6.1]
        at org.elasticsearch.action.support.replication.TransportReplicationAction$ReroutePhase.doRun(TransportReplicationAction.java:813) ~[elasticsearch-6.6.1.jar:6.6.1]
        at org.elasticsearch.common.util.concurrent.AbstractRunnable.run(AbstractRunnable.java:37) ~[elasticsearch-6.6.1.jar:6.6.1]
        at org.elasticsearch.action.support.replication.TransportReplicationAction$ReroutePhase$2.onTimeout(TransportReplicationAction.java:937) ~[elasticsearch-6.6.1.jar:6.6.1]
        at org.elasticsearch.cluster.ClusterStateObserver$ContextPreservingListener.onTimeout(ClusterStateObserver.java:322) ~[elasticsearch-6.6.1.jar:6.6.1]
        at org.elasticsearch.cluster.ClusterStateObserver.waitForNextChange(ClusterStateObserver.java:146) ~[elasticsearch-6.6.1.jar:6.6.1]
        at org.elasticsearch.cluster.ClusterStateObserver.waitForNextChange(ClusterStateObserver.java:117) ~[elasticsearch-6.6.1.jar:6.6.1]
        at org.elasticsearch.cluster.ClusterStateObserver.waitForNextChange(ClusterStateObserver.java:109) ~[elasticsearch-6.6.1.jar:6.6.1]
        at org.elasticsearch.action.support.replication.TransportReplicationAction$ReroutePhase.retry(TransportReplicationAction.java:923) ~[elasticsearch-6.6.1.jar:6.6.1]
        at org.elasticsearch.action.support.replication.TransportReplicationAction$ReroutePhase$1.handleException(TransportReplicationAction.java:902) ~[elasticsearch-6.6.1.jar:6.6.1]
        at org.elasticsearch.transport.TransportService$ContextRestoreResponseHandler.handleException(TransportService.java:1103) ~[elasticsearch-6.6.1.jar:6.6.1]
        at org.elasticsearch.transport.TransportService.lambda$onConnectionClosed$8(TransportService.java:958) ~[elasticsearch-6.6.1.jar:6.6.1]
        at org.elasticsearch.common.util.concurrent.ThreadContext$ContextPreservingRunnable.run(ThreadContext.java:660) [elasticsearch-6.6.1.jar:6.6.1]
        at java.util.concurrent.ThreadPoolExecutor.runWorker(ThreadPoolExecutor.java:1149) [?:1.8.0_191]
        at java.util.concurrent.ThreadPoolExecutor$Worker.run(ThreadPoolExecutor.java:624) [?:1.8.0_191]
        at java.lang.Thread.run(Thread.java:748) [?:1.8.0_191]

Here is a graph of when 40 cold nodes were rebooted at the same time and the shard initialization

image

And the response in the Logstash indexing rate. The problem didn't occur until after the shard initialization had been running for 10-15 minutes already.

image

Was that the only error in Elasticsearch's logs? This doesn't really tell us much. I'd expect at least a few others regarding failed to process cluster event (put-mapping) within 30s.

Writing a cluster state update is a pretty small amount of data, particularly if it's a mapping update to an index that doesn't have any shards on that node. You seem to be saying that this small amount of IO can't complete within 30 seconds because of contention? That's a surprisingly long time to wait.

Also, you're comparing 8 "concurrent rebuilds" (I assume you mean cluster.routing.allocation.node_concurrent_recoveries?) to 1. It sounds like your disks can't keep up with 8, but 1 is too slow for you. Have you tried any other numbers between 1 and 8? If your IO latency really is greater than 30 seconds at 8 then one would expect a lower number would give you better latency without really affecting the recovery speed. It might even be faster.

Apologies, there are a massive amount of logs to sort through.

cluster.routing.allocation.node_concurrent_recoveries: "8" = cluster state related timeouts
cluster.routing.allocation.node_concurrent_recoveries: "4" = cluster state related timeouts
cluster.routing.allocation.node_concurrent_recoveries: "2" = cluster state related timeouts
cluster.routing.allocation.node_concurrent_recoveries: "1" = no timeouts

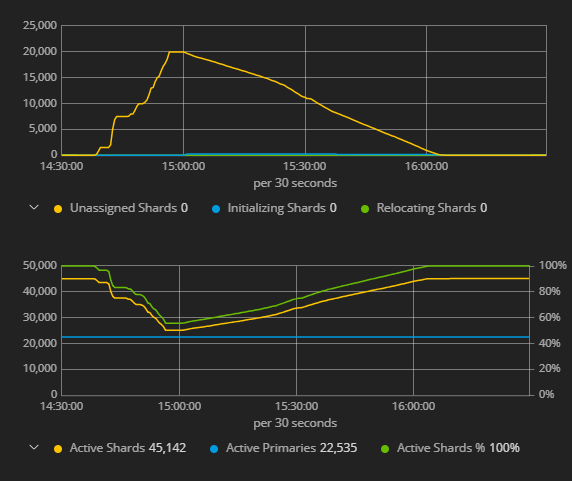
The issue that is hard to understand is that the cold SATA nodes is initializing shards --> which in turn causes Logstash to cease all indexing to the hot SSD nodes because it the put-mapping to the cluster state times out. This invariably ties the indexing on the hot nodes to the performance/availability of the cold nodes?

Enabling shard allocation
[2019-05-01T14:59:49,848][INFO ][o.e.c.s.ClusterSettings ] [esmstr-es-01] updating [cluster.routing.allocation.enable] from [new_primaries] to [all]

There are a bunch of these errors:

[2019-05-01T15:01:19,733][DEBUG][o.e.a.a.i.t.p.TransportPutIndexTemplateAction] [esmstr-es-01] failed to put template [kibana_index_template:.kibana]
org.elasticsearch.cluster.metadata.ProcessClusterEventTimeoutException: failed to process cluster event (create-index-template [kibana_index_template:.kibana], cause [api]) within 30s
        at org.elasticsearch.cluster.service.MasterService$Batcher.lambda$onTimeout$0(MasterService.java:127) ~[elasticsearch-6.7.1.jar:6.7.1]
        at java.util.ArrayList.forEach(ArrayList.java:1257) ~[?:1.8.0_201]
        at org.elasticsearch.cluster.service.MasterService$Batcher.lambda$onTimeout$1(MasterService.java:126) ~[elasticsearch-6.7.1.jar:6.7.1]
        at org.elasticsearch.common.util.concurrent.ThreadContext$ContextPreservingRunnable.run(ThreadContext.java:681) [elasticsearch-6.7.1.jar:6.7.1]
        at java.util.concurrent.ThreadPoolExecutor.runWorker(ThreadPoolExecutor.java:1149) [?:1.8.0_201]
        at java.util.concurrent.ThreadPoolExecutor$Worker.run(ThreadPoolExecutor.java:624) [?:1.8.0_201]
        at java.lang.Thread.run(Thread.java:748) [?:1.8.0_201]
[2019-05-01T15:01:23,620][DEBUG][o.e.a.a.i.t.p.TransportPutIndexTemplateAction] [esmstr-es-01] failed to put template [kibana_index_template:.kibana]
org.elasticsearch.cluster.metadata.ProcessClusterEventTimeoutException: failed to process cluster event (create-index-template [kibana_index_template:.kibana], cause [api]) within 30s
        at org.elasticsearch.cluster.service.MasterService$Batcher.lambda$onTimeout$0(MasterService.java:127) ~[elasticsearch-6.7.1.jar:6.7.1]
        at java.util.ArrayList.forEach(ArrayList.java:1257) ~[?:1.8.0_201]
        at org.elasticsearch.cluster.service.MasterService$Batcher.lambda$onTimeout$1(MasterService.java:126) ~[elasticsearch-6.7.1.jar:6.7.1]
        at org.elasticsearch.common.util.concurrent.ThreadContext$ContextPreservingRunnable.run(ThreadContext.java:681) [elasticsearch-6.7.1.jar:6.7.1]
        at java.util.concurrent.ThreadPoolExecutor.runWorker(ThreadPoolExecutor.java:1149) [?:1.8.0_201]
        at java.util.concurrent.ThreadPoolExecutor$Worker.run(ThreadPoolExecutor.java:624) [?:1.8.0_201]
        at java.lang.Thread.run(Thread.java:748) [?:1.8.0_201]

And a bunch of these errors:

[2019-05-01T15:01:26,060][WARN ][o.e.d.z.PublishClusterStateAction] [esmstr-es-01] timed out waiting for all nodes to process published state [983329] (timeout [30s], pending nodes: [{esdata-es-01}{ceLamsouQEqybbA-VxHiXg}{AlkIyh0VRCmrDgn3qkflmQ}{x.x.x.x}{x.x.x.x:9200}{evenodd=odd, xpack.installed=true, chassis=chassis153, tier=sata}])

And the error that matches with the Logstash error from above. There are tens of thousands of these errors that run all the way from 15:05 through to 16:05:

[2019-05-01T15:06:41,823][DEBUG][o.e.a.a.i.m.p.TransportPutMappingAction] [esmstr-es-01] failed to put mappings on indices [[[winlogbeat-2019.05.01/QZyYVT30Se63Edfp13WAbQ]]], type [doc]
org.elasticsearch.cluster.metadata.ProcessClusterEventTimeoutException: failed to process cluster event (put-mapping) within 30s
        at org.elasticsearch.cluster.service.MasterService$Batcher.lambda$onTimeout$0(MasterService.java:127) ~[elasticsearch-6.7.1.jar:6.7.1]
        at java.util.ArrayList.forEach(ArrayList.java:1257) ~[?:1.8.0_201]
        at org.elasticsearch.cluster.service.MasterService$Batcher.lambda$onTimeout$1(MasterService.java:126) ~[elasticsearch-6.7.1.jar:6.7.1]
        at org.elasticsearch.common.util.concurrent.ThreadContext$ContextPreservingRunnable.run(ThreadContext.java:681) [elasticsearch-6.7.1.jar:6.7.1]
        at java.util.concurrent.ThreadPoolExecutor.runWorker(ThreadPoolExecutor.java:1149) [?:1.8.0_201]
        at java.util.concurrent.ThreadPoolExecutor$Worker.run(ThreadPoolExecutor.java:624) [?:1.8.0_201]
        at java.lang.Thread.run(Thread.java:748) [?:1.8.0_201]

This message is curious, because it only lists a single node as having failed to write the cluster state within the timeout. Is it always this node, or do you see other nodes mentioned in these messages too?

I am doing a search/replace for servernames before posting, thus the same 'name' appearing in the log.

In the above issue, 40 of the cold nodes were restarted. During that 1 hour timeframe where the shards were reinitializing and those cluster timeout messages were occurring:

  • each of the 40 restarted and initializing cold nodes had those timeout messages
  • zero of the other cold nodes, and zero of the hot nodes, had those timeout messages
  • the timeout messages only occur for cold nodes when they are initializing shards. Once they finish, the timeouts stop for that node.

Sometimes those messages listed only a single cold node, sometimes they list multiple nodes.

Before the restart, POST /_flushed/sync was issued. The cold nodes hold older indices no longer being written to, the nodes were only initializing shards, there was zero data rebuild and zero translog replay.

Any more detail or logs on anything let me know, I'll go hunt it down and find it.

Does the cluster state get written/read through one of the threadpools? Or is it a seperate internal process that bypasses the threadpools?

I don't know which log exactly you are talking about here, but it'd be good if you could share some more comprehensive logs. Specifically, I'd like to see all the messages of the form timed out waiting for all nodes to process published state. Feel free to redact the node names and IP addresses, but please leave the random node IDs and the overall structure of the messages intact. It'll be too big to share here, but https://gist.github.com works well for this.

There's a single thread dedicated to applying cluster state updates, which includes writing them to disk, and this thread does essentially nothing else. It's named clusterApplierService#updateTask if you want to try and find it using jstack, and it should appear in the output of GET _nodes/hot_threads?threads=999999 if it's blocked on IO.

For completeness, there are a few other threads involved in receiving cluster state updates too - they start on a transport_worker thread and are then fairly quickly moved onto a generic thread to do most of the deserialisation, but the actual application of the update is normally the expensive bit and that's on the dedicated clusterApplierService#updateTask thread.

Edit: this is true in 7.x, but it looks like in 6.x we go straight from the transport_worker thread to the dedicated cluster applier thread without the intermediate generic thread.

I am working on cleaning sensitive info from all the logs and will be uploading them. Have been doing some more testing in the mean time. The number of concurrent recoveries/rebalance doesn't have much of an effect. However, indices.recovery.max_bytes_per_second has a huge impact.

Here is the normal cluster settings.
{
"persistent" : {
"cluster" : {
"routing" : {
"allocation" : {
"cluster_concurrent_rebalance" : "2",
"node_concurrent_recoveries" : "8",
"node_initial_primaries_recoveries" : "8",
"awareness" : {
"attributes" : "chassis,evenodd"
},
"enable" : "all"
}
}
},
"indices" : {
"recovery" : {
"max_bytes_per_sec" : "400mb"
}
},
"search" : {
"default_search_timeout" : "3m",
"low_level_cancellation" : "true"
}
}

Dropping the indices.recovery.max_bytes_per_second setting to 100mb largely avoids the above problem of cluster state timeouts. Also while doing this I noticed the following results running 'top' on each of the nodes.
400mb = CPU wait time is high, 20% or higher
100mb = CPU wait time is low, usually lower then 1%

I am still working on sanitizing all the logs...but there does seem to be some correlation between how much data is being written to the SATA disk and cluster state timeout errors.

Ok, good catch. Why did you set this so high? Do you have other evidence that your disks can support this kind of sustained write load? 400MB/s is a lot to ask of a spinning disk (note that this is megabytes, not megabits).

Its a hot/cold cluster. The hot nodes all have NVMe based SSD drives so 400MB/s is entirely possible and have seen 15Gbps of network traffic per node during rebuilds.

For the cold SATA nodes I would entirely agree, 400MB/s is entirely too much and the default 40MB/s is a much better setting.

I see, ok, that's pretty impressive.

You can configure indices.recovery.max_bytes_per_second on a node-by-node basis if you set it in each node's elasticsearch.yml file rather than via the _cluster/settings API. If you need the extra performance on the hot nodes then you could set it to 400mb there and leave it unset on the cold nodes to use the default.

For the per-node setting to take effect you'll need to remove it from the dynamic settings by setting it to null:

PUT _cluster/settings
{"persistent":{"indices.recovery.max_bytes_per_second":null}}

I see. Honestly never occurred to do it that way.

If I set it to 400 on the NVMe hot nodes, and null in the cluster level (default to 40), anything to/from a SATA node will be limited to 40 and anything NVMe<->NVMe will be 400?

Yes that's right. It's a node-wide limit on the total of all incoming and outgoing recoveries, and applies at both ends of the recovery (recipient and sender), so you could in theory have one hot node serving 10 recoveries to 10 different cold nodes, all at 40MB/s.

1 Like

This topic was automatically closed 28 days after the last reply. New replies are no longer allowed.