Elasticsearch High CPU Usage - GC Not Working

I am running a 5 node ES 1.7.5 cluster and have been running into the same issue for the past few weeks: after running perfectly smoothly for about a week, the nodes start using 100% CPU and become unresponsive. I normally have to manually restart the nodes to get them working again.

It appears as if the GC is not working properly, here is a line from the logs:

[2016-06-23 17:44:23,621][WARN ][monitor.jvm] 
[elasticsearch1-elasticsearch-5-vm] [gc][old][218473][270] 
duration [1.2m], collections [1]/[1.2m], total [1.2m]/[17.7m], 
memory [25.2gb]->[25.2gb]/[25.9gb], 
all_pools {[young] [196.5mb]->[141.6mb]/[532.5mb]}{[survivor] 
[66.5mb]->[0b]/[66.5mb]}{[old] [25gb]->[25gb]/[25.3gb]}

I looked at my fielddata shortly before and it appears to be only around 1.5GB, so I don't think field data is taking up so much heap. What else would be using so much heap?

Is the solution to this simply adding more memory to the system? It seems as if there is a memory leak, as this problem takes a few days to appear.

Anyone have an idea how to debug this?

2 Likes

Can you dump the heap and see what's consuming it?

I keep getting the following errors whenever I use jmap:

$ sudo jmap -dump:format=b,file=heap.hprof 25945
25945: Unable to open socket file: target process not responding or HotSpot VM not loaded
The -F option can be used when the target process is not responding

$ sudo jmap -F -dump:format=b,file=heap.hprof 25945
Attaching to process ID 25945, please wait...
Exception in thread "main" java.lang.reflect.InvocationTargetException
        at sun.reflect.NativeMethodAccessorImpl.invoke0(Native Method)
        at sun.reflect.NativeMethodAccessorImpl.invoke(NativeMethodAccessorImpl.java:62)
        at sun.reflect.DelegatingMethodAccessorImpl.invoke(DelegatingMethodAccessorImpl.java:43)
        at java.lang.reflect.Method.invoke(Method.java:498)
        at sun.tools.jmap.JMap.runTool(JMap.java:201)
        at sun.tools.jmap.JMap.main(JMap.java:130)
Caused by: java.lang.RuntimeException: zero stride: cannot read types.
        at sun.jvm.hotspot.HotSpotTypeDataBase.readVMTypes(HotSpotTypeDataBase.java:173)
        at sun.jvm.hotspot.HotSpotTypeDataBase.<init>(HotSpotTypeDataBase.java:89)
        at sun.jvm.hotspot.HotSpotAgent.setupVM(HotSpotAgent.java:395)
        at sun.jvm.hotspot.HotSpotAgent.go(HotSpotAgent.java:305)
        at sun.jvm.hotspot.HotSpotAgent.attach(HotSpotAgent.java:140)
        at sun.jvm.hotspot.tools.Tool.start(Tool.java:185)
        at sun.jvm.hotspot.tools.Tool.execute(Tool.java:118)
        at sun.jvm.hotspot.tools.HeapDumper.main(HeapDumper.java:83)
        ... 6 more

Okay, I got through these errors and now have a massive heap dump. What do I do now?

For others who come across this, here's what I did to get the heap dump:

# Get jmap
sudo apt-get install openjdk-8-jdk
# Get the PID of the elasticsearch instance:
ps -aux|grep elasticsearch|grep -v grep
# Switch into root
sudo su
# Switch into the elasticsearch user
su elasticsearch
# Dump the heap (you better have enough disk space for it)
jmap -dump:format=b,file=heap.hprof <PID_FROM_STEP_1>

You need to execute jmap as the user running the Elasticsearch process.

Open it in VisualVM and inspect what is taking up all the space in the heap.

Okay, loaded the heap dump into VisualVM and I got the following output. It looks like the vast majority of the heap is taken by org.apache.lucene.search.ScoreDoc. From it's name, I assume that is keeping a score for every document in memory, no? Is this normal? Any way to reduce this data memory load?

It holds a single search hit. Can you click through to several instances and show nearest GC root and see what's holding on to them?

It's a 17GB dump and my computer is not very happy processing it. VisualVM is taking literally 30 minutes to respond to each click.

I suspect that the heavy heap use may be a result of overly aggressive caching in ES 1.x as described in the documentation. Could that explain this behavior? If so, I may try setting _cache to false in my queries to see if that makes a difference.

You can increase the heap assigned to VisualVM. Start it with the flag -J-Xmx8g, for example, to increase the heap to 8 GB (go as high as you can up to your physical RAM).

I'm not convinced.

Okay, clicked on a bunch and they all say "No GC Root" (see below). Not sure what that means.

Here's a sample of the score doc object:

And here is another:

I can't tell if this is abnormal or not. Finally, this is the top 20 largest objects in the summary panel:

Can you determine anything from this? What else can I try?

Maybe it's the completion suggester that is causing the problems? Below is /_stats/completion?pretty&human (abridged). The completion index is 25gb. If the completion suggester FST needs to be in each node's memory, that would be problematic. But I'm running five nodes, so if it's split across them, 5gb does not seem so bad.

{
  "_shards" : {
    "total" : 10,
    "successful" : 10,
    "failed" : 0
  },
  "indices" : {
    "da-prod7" : {
      "primaries" : {
        "completion" : {
          "size" : "12.4gb",
          "size_in_bytes" : 13374010920
        }
      },
      "total" : {
        "completion" : {
          "size" : "24.9gb",
          "size_in_bytes" : 26746738552
        }
      }
    }
  }
}

These hits are not held in the cache, and anyway they are not rooted (retained size is zero) so they are not what is preventing the GC from freeing space in your heap.

Your last VisualVM screenshot shows significant memory being retained by the completion suggester. That appears to be the culprit here.

Yes, it seems that way. Any suggestions on dealing with this other than increasing memory and/or reducing what I am putting in the suggester?

Those are your only options here, suggesters are heap hungry.

Hmm, this still doesn't make sense. The total completion suggester is 12.4gb. I have five nodes, five shards, and two shards per node (1 replication), so that means each shard should use about 5gb of memory for the completion searcher (12.4gb / 5 nodes * 2 nodes / shard). Each node has 54gb of memory, and I'm devoting 30gb to ES heap. Just 5gb of completion shouldn't put ES into this type of state.

Also, should I be getting OutOfMemory errors rather than just spinning cycles?

When I have had similar problem it was because of ttl running, so just asking do you ttl your indexes?

What is TTL? The terminal?

This crash happened again. This time I had Marvel / Kibana setup, so I have detailed logging. Some of the charts are below, but I converted the output to a PDF showing all events.

It's difficult to really understand what is happening. The charts show that right before the crash, memory increased a bit, and the JVM spent most of its time trying to garbage collect. This increased the load. The machine became relatively unresponsive.

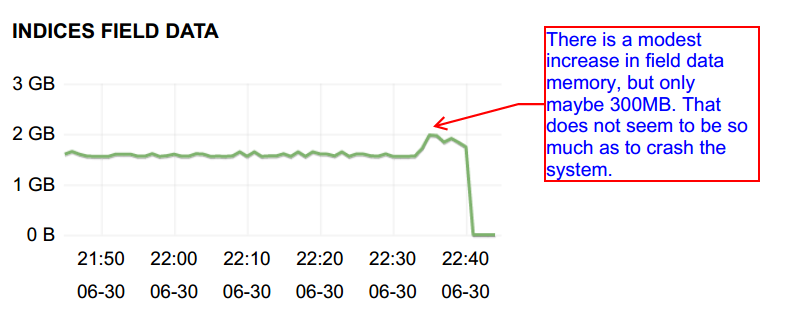
The only culprit seems to be field data, which increased right before the crash:

But this increase seems relatively modest, a few hundred MB at most. It seems unclear why this would take down the entire node. Also, this memory only really increased at around 22:34, whereas the instability started a few minutes earlier. So this increased field data may be an effect of the error, not a cause of it.

This seems like an important issue because the instability of a single machine is affecting the stability of an entire cluster. This is because the node did not crash, but became relatively unresponsive. The master kicked the node out of the cluster, and then added it back again and again. The subsequent intense relocating made the entire cluster unresponsive. This breaks Elasticsearch's high availability assurances.

And for the sake of completeness, here are the log output right at the crash time of 22:33

[2016-07-01 02:33:09,415][INFO ][monitor.jvm              ] [elasticsearch1-elasticsearch-3-vm] [gc][young][272253][28134] duration [881ms], collections [1]/[1.7s], total [881ms]/[2.5h], memory [23.6gb]->[23.9gb]/[29.9gb], all_pools {[young] [77.6mb]->[8.9mb]/[532.5mb]}{[survivor] [66.5mb]->[66.5mb]/[66.5mb]}{[old] [23.4gb]->[23.8gb]/[29.3gb]}
[2016-07-01 02:33:10,584][WARN ][monitor.jvm              ] [elasticsearch1-elasticsearch-3-vm] [gc][young][272254][28135] duration [1s], collections [1]/[1.1s], total [1s]/[2.5h], memory [23.9gb]->[24.4gb]/[29.9gb], all_pools {[young] [8.9mb]->[6.8mb]/[532.5mb]}{[survivor] [66.5mb]->[66.5mb]/[66.5mb]}{[old] [23.8gb]->[24.4gb]/[29.3gb]}
[2016-07-01 02:33:27,199][WARN ][monitor.jvm              ] [elasticsearch1-elasticsearch-3-vm] [gc][young][272270][28138] duration [1s], collections [1]/[1.2s], total [1s]/[2.5h], memory [25gb]->[25.5gb]/[29.9gb], all_pools {[young] [21.4mb]->[50.2mb]/[532.5mb]}{[survivor] [66.5mb]->[66.5mb]/[66.5mb]}{[old] [24.9gb]->[25.4gb]/[29.3gb]}
[2016-07-01 02:33:33,712][INFO ][monitor.jvm              ] [elasticsearch1-elasticsearch-3-vm] [gc][young][272276][28139] duration [822ms], collections [1]/[1.5s], total [822ms]/[2.5h], memory [25.9gb]->[26gb]/[29.9gb], all_pools {[young] [453.5mb]->[161.4mb]/[532.5mb]}{[survivor] [66.5mb]->[66.5mb]/[66.5mb]}{[old] [25.4gb]->[25.8gb]/[29.3gb]}
[2016-07-01 02:33:34,958][WARN ][monitor.jvm              ] [elasticsearch1-elasticsearch-3-vm] [gc][young][272277][28140] duration [1s], collections [1]/[1.2s], total [1s]/[2.5h], memory [26gb]->[26.4gb]/[29.9gb], all_pools {[young] [161.4mb]->[18.9mb]/[532.5mb]}{[survivor] [66.5mb]->[66.5mb]/[66.5mb]}{[old] [25.8gb]->[26.3gb]/[29.3gb]}
[2016-07-01 02:33:36,210][INFO ][monitor.jvm              ] [elasticsearch1-elasticsearch-3-vm] [gc][young][272278][28141] duration [940ms], collections [1]/[1.2s], total [940ms]/[2.5h], memory [26.4gb]->[26.8gb]/[29.9gb], all_pools {[young] [18.9mb]->[48.9mb]/[532.5mb]}{[survivor] [66.5mb]->[66.5mb]/[66.5mb]}{[old] [26.3gb]->[26.7gb]/[29.3gb]}
[2016-07-01 02:33:44,758][INFO ][monitor.jvm              ] [elasticsearch1-elasticsearch-3-vm] [gc][young][272286][28143] duration [888ms], collections [1]/[1.5s], total [888ms]/[2.5h], memory [27gb]->[27.4gb]/[29.9gb], all_pools {[young] [63.1mb]->[3.1mb]/[532.5mb]}{[survivor] [66.5mb]->[66.5mb]/[66.5mb]}{[old] [26.8gb]->[27.3gb]/[29.3gb]}
[2016-07-01 02:33:46,338][INFO ][monitor.jvm              ] [elasticsearch1-elasticsearch-3-vm] [gc][young][272287][28144] duration [790ms], collections [1]/[1.5s], total [790ms]/[2.5h], memory [27.4gb]->[27.9gb]/[29.9gb], all_pools {[young] [3.1mb]->[98.9mb]/[532.5mb]}{[survivor] [66.5mb]->[66.5mb]/[66.5mb]}{[old] [27.3gb]->[27.8gb]/[29.3gb]}
[2016-07-01 02:33:47,538][WARN ][monitor.jvm              ] [elasticsearch1-elasticsearch-3-vm] [gc][young][272288][28145] duration [1s], collections [1]/[1.2s], total [1s]/[2.5h], memory [27.9gb]->[28.3gb]/[29.9gb], all_pools {[young] [98.9mb]->[3.7mb]/[532.5mb]}{[survivor] [66.5mb]->[66.5mb]/[66.5mb]}{[old] [27.8gb]->[28.3gb]/[29.3gb]}

Any other insights or recommendations into this issue?

Can anyone help here? This continues to happen on a weekly basis to my cluster. It seems really bad that a single node can take down a cluster.