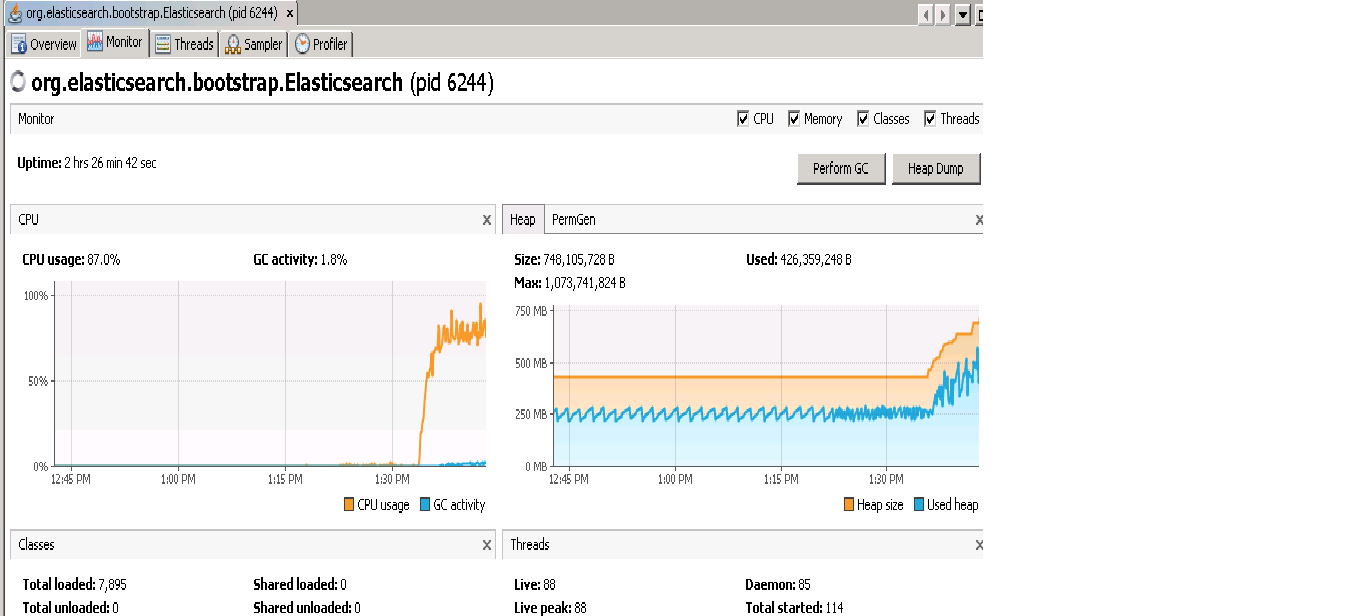
This is my output of hot threads ! cpu usage is 100 % please suggest something
::: [Mad Dog Rassitano][2dJw-2L7QCaMF2aFWwvVHQ][bladem610][inet[/127.0.0.1:9300]]
Hot threads at 2016-05-24T09:42:51.992Z, interval=500ms, busiestThreads=3, ignoreIdleThreads=true:
37.4% (187.2ms out of 500ms) cpu usage by thread 'elasticsearch[Mad Dog Rassitano][search][T#9]'
5/10 snapshots sharing following 14 elements
org.elasticsearch.search.internal.ContextIndexSearcher.search(ContextIndexSearcher.java:191)
org.apache.lucene.search.IndexSearcher.search(IndexSearcher.java:491)
org.apache.lucene.search.IndexSearcher.search(IndexSearcher.java:448)
org.apache.lucene.search.IndexSearcher.search(IndexSearcher.java:281)
org.apache.lucene.search.IndexSearcher.search(IndexSearcher.java:269)
org.elasticsearch.search.query.QueryPhase.execute(QueryPhase.java:157)
org.elasticsearch.search.SearchService.loadOrExecuteQueryPhase(SearchService.java:301)
org.elasticsearch.search.SearchService.executeQueryPhase(SearchService.java:312)
org.elasticsearch.search.action.SearchServiceTransportAction$5.call(SearchServiceTransportAction.java:231)
org.elasticsearch.search.action.SearchServiceTransportAction$5.call(SearchServiceTransportAction.java:228)
org.elasticsearch.search.action.SearchServiceTransportAction$23.run(SearchServiceTransportAction.java:559)
java.util.concurrent.ThreadPoolExecutor.runWorker(ThreadPoolExecutor.java:1145)
java.util.concurrent.ThreadPoolExecutor$Worker.run(ThreadPoolExecutor.java:615)
java.lang.Thread.run(Thread.java:745)
5/10 snapshots sharing following 2 elements
java.util.concurrent.ThreadPoolExecutor$Worker.run(ThreadPoolExecutor.java:615)
java.lang.Thread.run(Thread.java:745)
28.1% (140.4ms out of 500ms) cpu usage by thread 'elasticsearch[Mad Dog Rassitano][search][T#6]'
2/10 snapshots sharing following 20 elements
org.elasticsearch.search.aggregations.AggregationPhase$AggregationsCollector.collect(AggregationPhase.java:161)
org.elasticsearch.common.lucene.MultiCollector.collect(MultiCollector.java:60)
org.apache.lucene.search.Weight$DefaultBulkScorer.scoreAll(Weight.java:193)
org.apache.lucene.search.Weight$DefaultBulkScorer.score(Weight.java:163)
org.apache.lucene.search.BulkScorer.score(BulkScorer.java:35)
org.apache.lucene.search.IndexSearcher.search(IndexSearcher.java:621)
org.elasticsearch.search.internal.ContextIndexSearcher.search(ContextIndexSearcher.java:191)
org.apache.lucene.search.IndexSearcher.search(IndexSearcher.java:491)
org.apache.lucene.search.IndexSearcher.search(IndexSearcher.java:448)
org.apache.lucene.search.IndexSearcher.search(IndexSearcher.java:281)
org.apache.lucene.search.IndexSearcher.search(IndexSearcher.java:269)
org.elasticsearch.search.query.QueryPhase.execute(QueryPhase.java:157)