Hello
I am looking for solution to prepare dashboard in which i need to prepare a visualization with difference value
e.g. site performance field mentioned as 500ms but as per threshold it should be 200ms
Field name "A" contains the performance number which 500ms
Requirement I want to obtain the difference between the performance number which is field "A" with performance threashold 200ms
Kindly assist if it is possible and how we can use it for dashboard
Regards
Pratiksha
Hi @pratikshatiwari
I think you have two options in Lens for your case:
- either use a "Reference line" here rather than a difference to show a comparison baseline - see the "Static value" in the special layer at the bottom
- Use a formula to compute the delta ( value - static value ):

hi @Marco_Liberati
Thank you for the responce, but the obtained visualization not working out for me
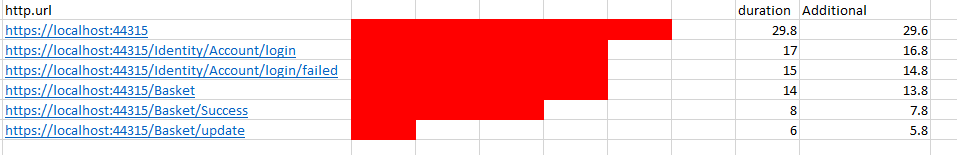
I have created attached visualization in tsvb, i need to add one more number column next to second column with substracted no.
e.g. first url hit time is 29.48s and and next to that i want to add one more column with substracted no. e.g "28.88s"
As 28.88 second obtained after substracting 29.48 with 200 ms

All i want to achieve here is to show the url which created high hit along with theii hit number & recomended no. to come down be healthy site by substracting with average threshold
Same loginc i want to apply all
PFA example visualization view from excel
Regards
Pratiksha
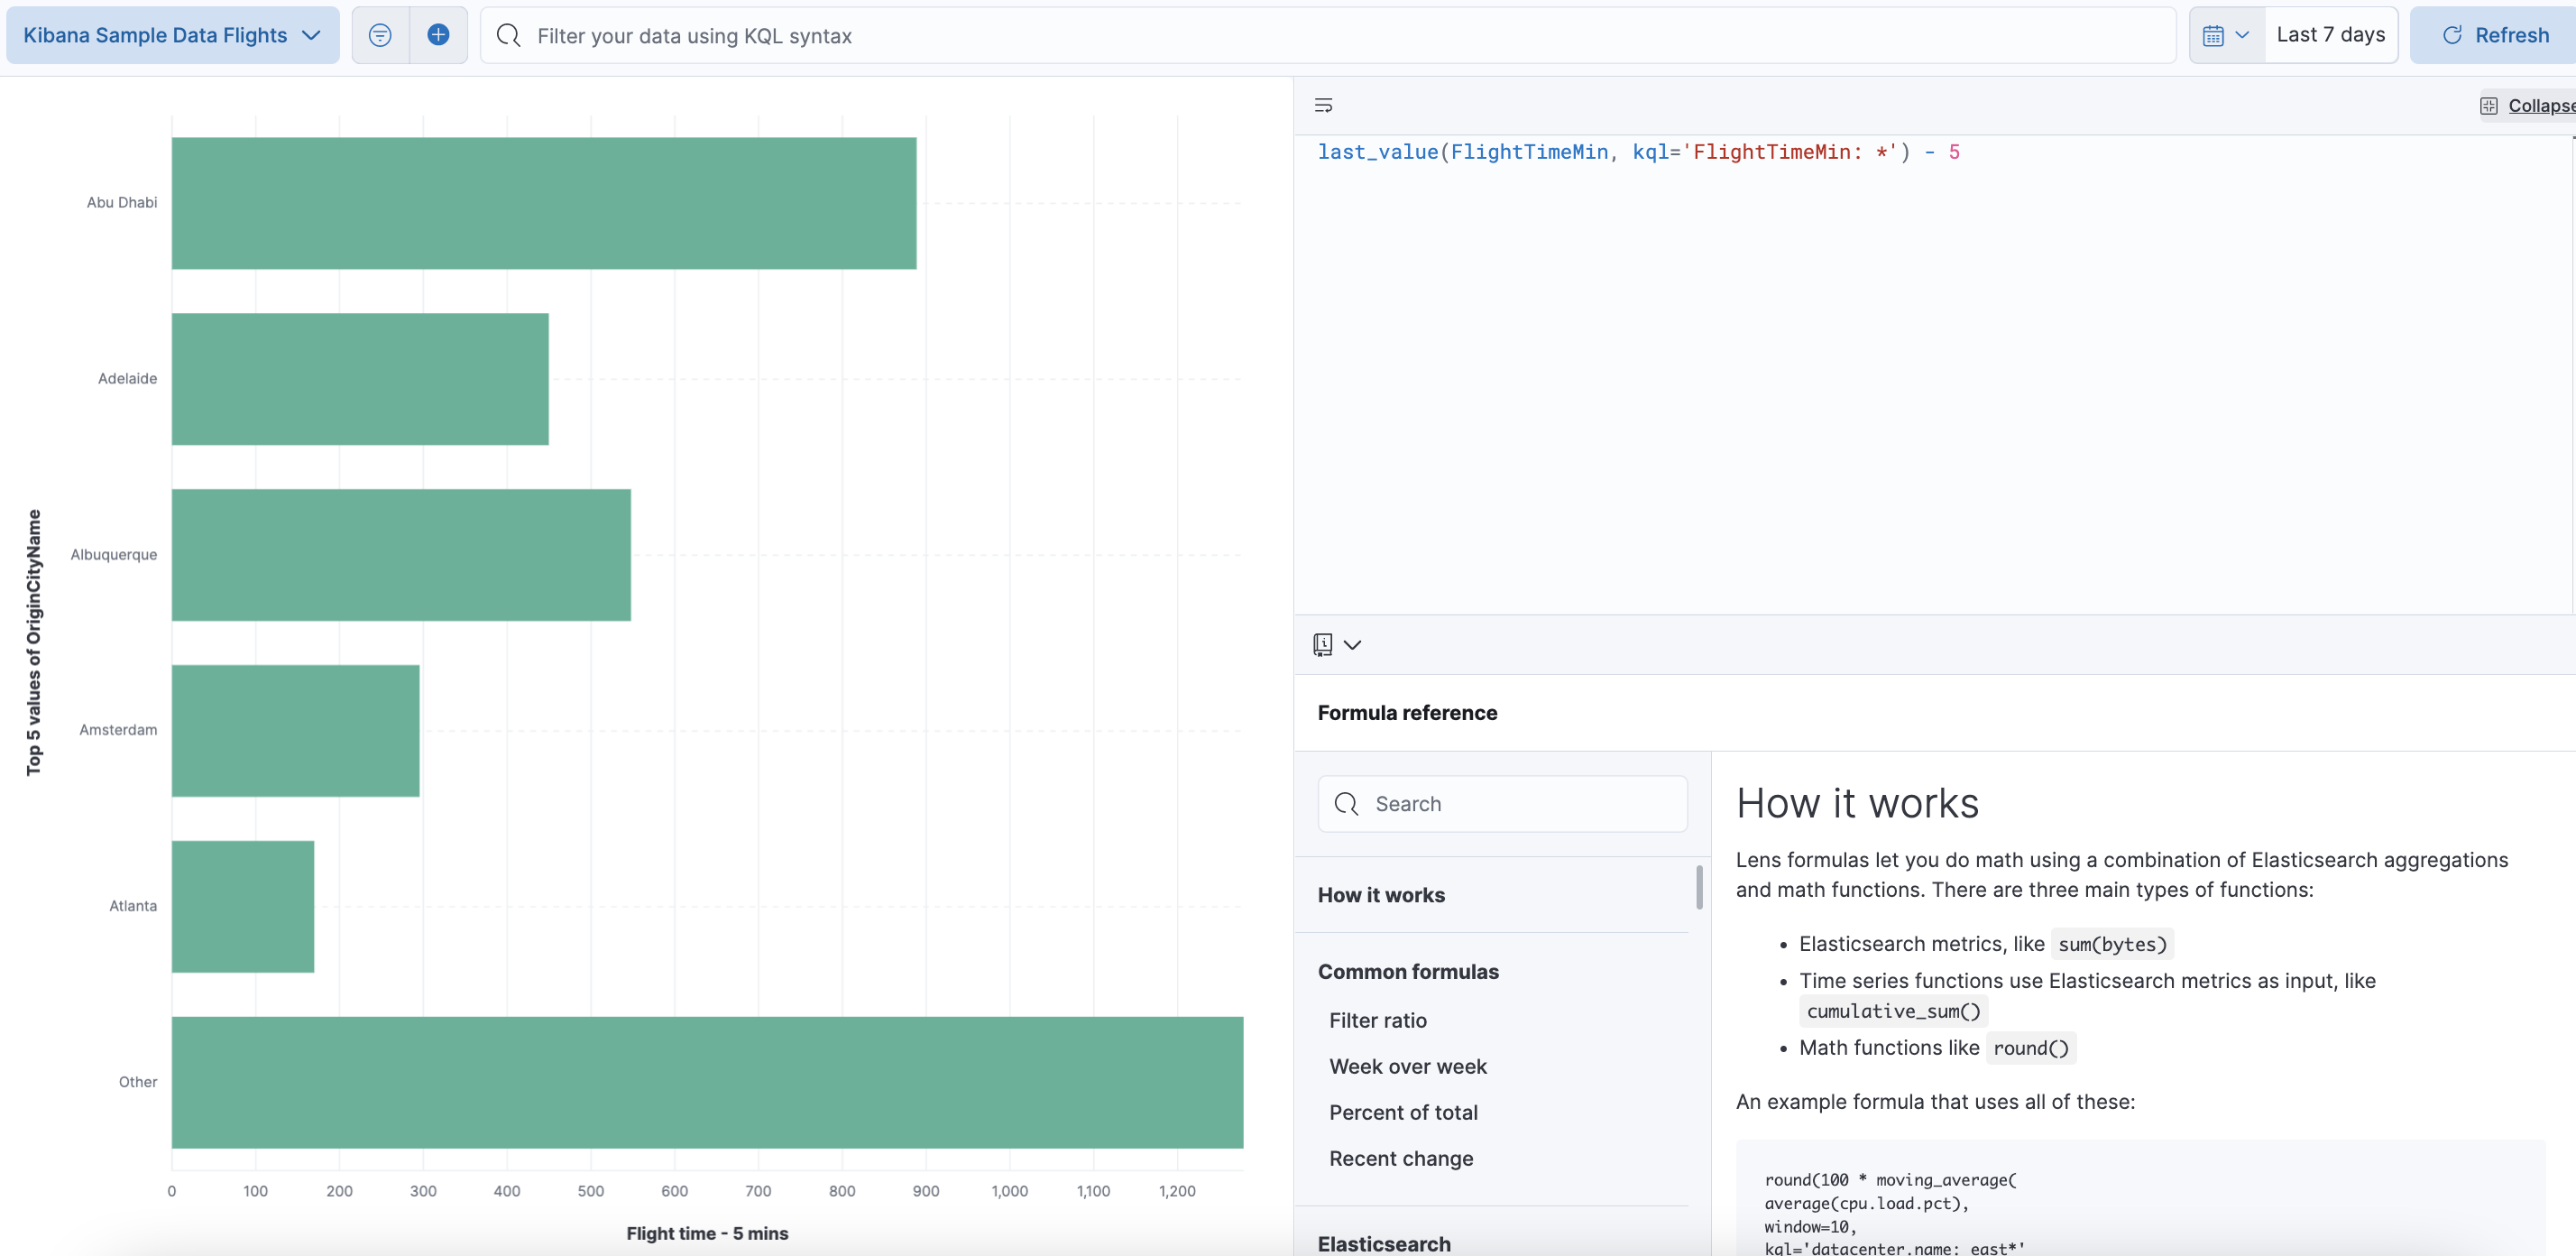
I see your use case, I think the second option with formula should work ok in your case then.
I've quickly put together a similar chart using the flight sample date here:
For each airport city I'm taking the last flight time (in minutes) and remove 5 minutes from each.
It is not clear which aggregation you've used in the TSVB, but it can be applied in Lens formula as well (change last_value to max or any other metric agg you've used).