Hi
i am using es 5.6 with two nodes, first node using 76 % memory (total 16 gb), mlock already true. please suggest to reduce this % memory.
What is your heap set at?
What does _cat/nodes show?
Hi warkolm,
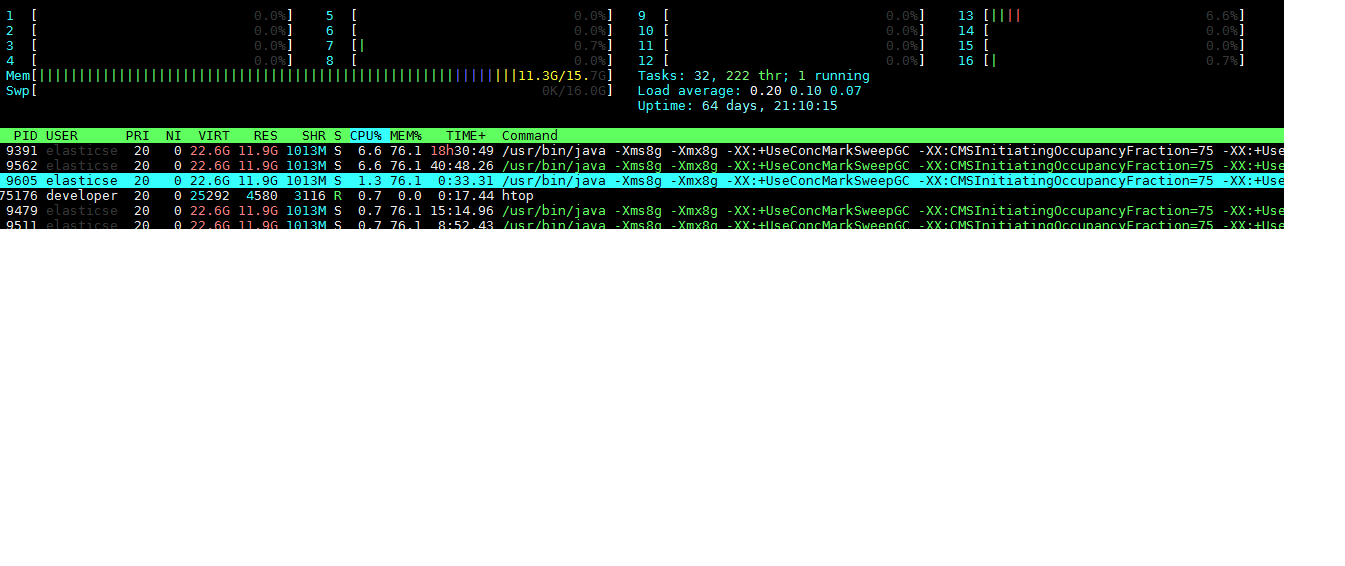
heap size is 8 gb as you can see in image file, and _cat/nodes resule is 
192.168.1.xxx 45 96 0 0.07 0.07 0.02 mdi * node1
192.168.1.yyy 63 99 0 0.56 0.18 0.11 mdi - node2
I can't see that image, it's too small sorry to say.
If you have heap at 8GB then Elasticsearch won't use more than that. What you are seeing is the OS allocating system memory to cache files Elasticsearch is using.
ip heap.percent ram.percent cpu load_1m load_5m load_15m node.role master name
192.168.1.xxx 45 96 0 0.07 0.07 0.02 mdi * node1
192.168.1.yyy 63 99 0 0.56 0.18 0.11 mdi - node2
total ram size is 16 gb and heap is 8 gb..(how can i check heap)
Please don't post images of text as they are hardly readable and not searchable.
Instead paste the text and format it with </> icon. Check the preview window.
Hi dadoonet,
i am using htop command from where i can not copy , that's why sending image file..its showing 75 % memory used.. please have a look..