Hey,
We are facing an issue after upgrading from ELK 5.6 to 6.6.1. We had around 1,5k index fields prior to update, now we are left with ~30.
We have 2TC nodes with 1 controller on which we have ELK, APM, Metricbeats
This is out current index filed list that we are using.

This is our input_tomcat.conf file
This is part of our old config, logstash wouldn't start with it
config_old
We thought that there might be an issue with our custom grok filter but we still cannot get the fields that we want to filter our logs with.
In logstash logs we have this:
Mar 08 10:14:33 portal-nfs-elk logstash[11997]: [2019-03-08T10:14:33,074][WARN ][logstash.outputs.elasticsearch] Could not index event to Elasticsearch. {:status=>400, :action=>["index", {:_id=>nil, :_index=>"filebeat-2019.03.08", :_type=>"doc", :routing=>nil}, #LogStash::Event:0x19e1d95], :response=>{"index"=>{"_index"=>"filebeat-2019.03.08", "_type"=>"doc", "_id"=>"zNFeXGkB9jtq3mp7Oh9j", "status"=>400, "error"=>{"type"=>"illegal_argument_exception", "reason"=>"Rejecting mapping update to [filebeat-2019.03.08] as the final mapping would have more than 1 type: [log, doc]"}}}}
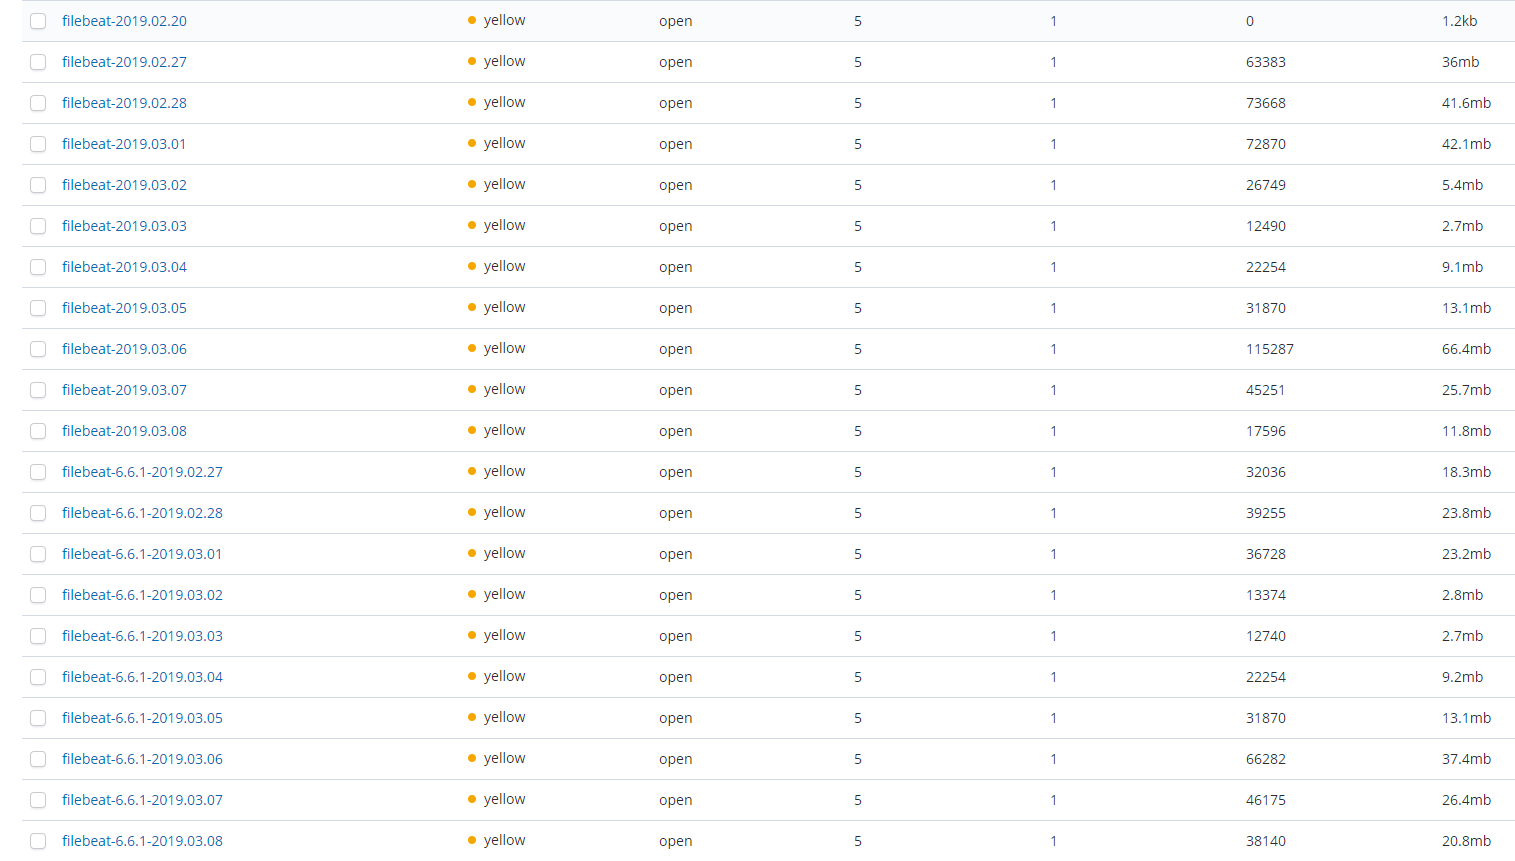
Here is our shard list
Of course we can find the "correlation" in raw log but we don't have the option to filter our logs after correlation in Kibana.
Thanks,