I have been running a cluster of ES servers (5) with 48GB of RAM. They have
32 GB allocated to the ES process and are configured to use a static
maximum 60% of that RAM for the index field cache. They have been running
with this configuration for weeks.
I have a jmx ganglia plugin that shows the servers hovering right around
28GB of JVM Heap usage for the last few weeks.
This morning the memory the leader of the cluster spiked to fill the entire
JVM allocated size (32 GB) and then further spiked to 35GB a few minutes
later (I am guessing this is while it was writing the heap dump).
The odd thing is that the amount of data being indexed at the time was
below the average that we had been indexing during the last few weeks. As
far as I can tell, there were no unconventional index or search requests at
that time.
The logs don't show anything helpful - just a bunch of GC's starting at the
memory spike time and then a bunch of out of memory exceptions (nothing
surprising).
Given that the index field cache size is fixed (and I have verified this
with various tests over the last few weeks), I am not sure what is causing
this sudden spike in memory.
Could optimizing or flushing cause such a spike?
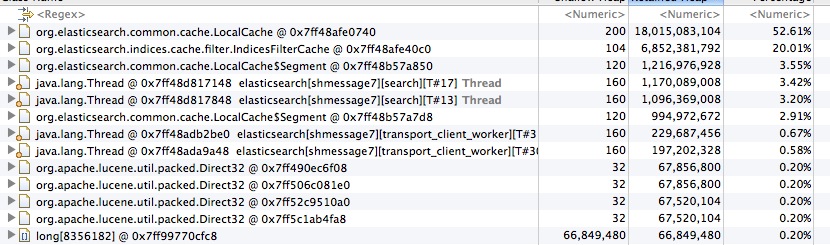
This is what the top few largest memory objects from Eclipse MAT look like:
My apologies for not including this in the original post:
ES version: 0.90.2
java version "1.7.0_09-icedtea"
OpenJDK Runtime Environment (rhel-2.3.8.0.el6_4-x86_64)
OpenJDK 64-Bit Server VM (build 23.7-b01, mixed mode)
On Wednesday, September 25, 2013 3:27:16 AM UTC-4, Jörg Prante wrote:
Note that we do not use G1GC because there is an issue with some of the
concurrent containers in ES when used in conjunction with G1GC.
~joe!
On Wednesday, September 25, 2013 10:19:30 AM UTC-4, Joseph Smith wrote:
My apologies for not including this in the original post:
ES version: 0.90.2
java version "1.7.0_09-icedtea"
OpenJDK Runtime Environment (rhel-2.3.8.0.el6_4-x86_64)
OpenJDK 64-Bit Server VM (build 23.7-b01, mixed mode)
On Wednesday, September 25, 2013 3:27:16 AM UTC-4, Jörg Prante wrote:
I've also noticed that once in a while a server will just to a very high
field cache size, despite my configuration.
In elasticsearch.yaml, I have: indices.fielddata.cache.size: 50%.
In my mapping, I have: "index.fielddata.cache" : "node".
Most of the time the servers stay fixed at around 13-15GB (50% of the JVM
heap size), but once in a while one will suddenly go up to: 21-26GB, which
is much more than I specified.
~joe!
On Wednesday, September 25, 2013 10:21:35 AM UTC-4, Joseph Smith wrote:
Note that we do not use G1GC because there is an issue with some of the
concurrent containers in ES when used in conjunction with G1GC.
~joe!
On Wednesday, September 25, 2013 10:19:30 AM UTC-4, Joseph Smith wrote:
My apologies for not including this in the original post:
ES version: 0.90.2
java version "1.7.0_09-icedtea"
OpenJDK Runtime Environment (rhel-2.3.8.0.el6_4-x86_64)
OpenJDK 64-Bit Server VM (build 23.7-b01, mixed mode)
On Wednesday, September 25, 2013 3:27:16 AM UTC-4, Jörg Prante wrote:
So I have narrowed this down to the following problem:
If I specify a static fielddata cache size with a large value, say 16gb,
then the value is ignored and I eventually OOM.
If I instead use a small value, say 2gb, then the field data cache size
stays within the specified limit.
I have now tested this with the latest Oracle/Sun JDK and with OpenJDK. It
repros in both scenarios.
~joe!
On Wednesday, September 25, 2013 1:20:15 PM UTC-4, Joseph Smith wrote:
I've also noticed that once in a while a server will just to a very high
field cache size, despite my configuration.
In elasticsearch.yaml, I have: indices.fielddata.cache.size: 50%.
In my mapping, I have: "index.fielddata.cache" : "node".
Most of the time the servers stay fixed at around 13-15GB (50% of the JVM
heap size), but once in a while one will suddenly go up to: 21-26GB, which
is much more than I specified.
~joe!
On Wednesday, September 25, 2013 10:21:35 AM UTC-4, Joseph Smith wrote:
Note that we do not use G1GC because there is an issue with some of the
concurrent containers in ES when used in conjunction with G1GC.
~joe!
On Wednesday, September 25, 2013 10:19:30 AM UTC-4, Joseph Smith wrote:
My apologies for not including this in the original post:
ES version: 0.90.2
java version "1.7.0_09-icedtea"
OpenJDK Runtime Environment (rhel-2.3.8.0.el6_4-x86_64)
OpenJDK 64-Bit Server VM (build 23.7-b01, mixed mode)
On Wednesday, September 25, 2013 3:27:16 AM UTC-4, Jörg Prante wrote:
Apache, Apache Lucene, Apache Hadoop, Hadoop, HDFS and the yellow elephant
logo are trademarks of the
Apache Software Foundation
in the United States and/or other countries.