Hi guys,
I want to do some response tests on Elasticsearch by sending a log with the following structure:
2020-05-08T14:00:34,177+0300 | INFO | FRONB100139 | P2116 | [main] | ResponseTimeTest.App | This is a test message | b047f825-5a40-49f5-97b4-66e9efc58e86
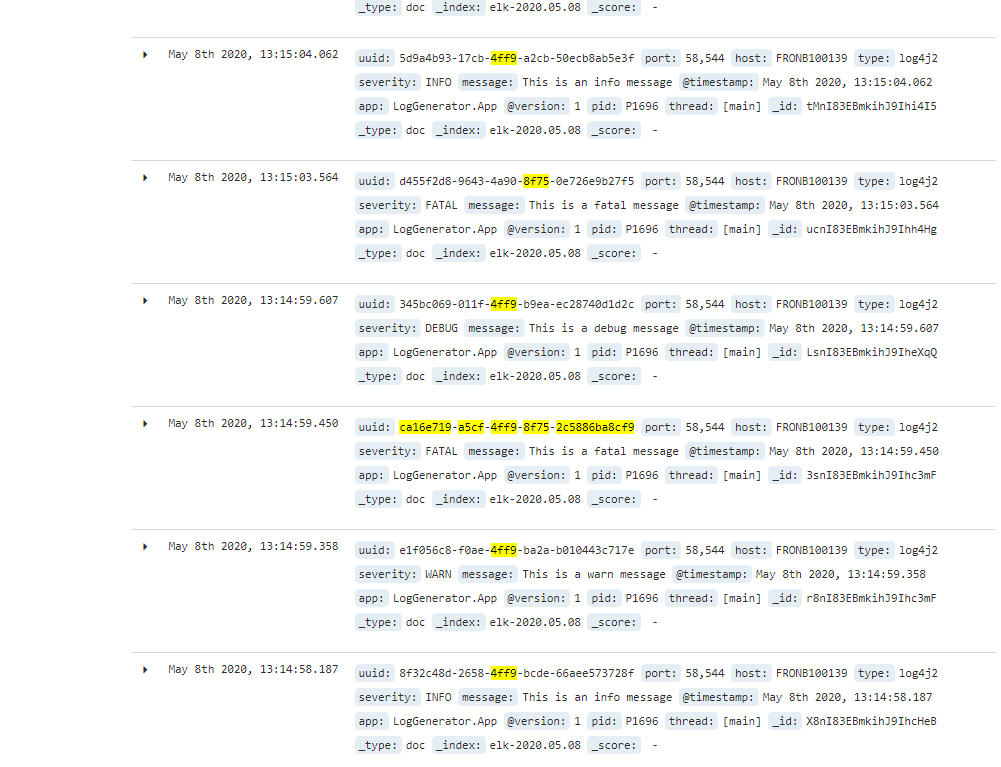
But when querying Elasticsearch for the UUID b047f825-5a40-49f5-97b4-66e9efc58e86 it returns multiple results. For example:
{
  "took" : 108,
  "timed_out" : false,
  "_shards" : {
    "total" : 5,
    "successful" : 5,
    "skipped" : 0,
    "failed" : 0
  },
  "hits" : {
    "total" : 315,
    "max_score" : 52.394894,
    "hits" : [
      {
        "_index" : "elk-2020.05.08",
        "_type" : "doc",
        "_id" : "3cvx83EBmkihJ9Ihqp2N",
        "_score" : 52.394894,
        "_source" : {
          "port" : 60732,
          "uuid" : "b047f825-5a40-49f5-97b4-66e9efc58e86",
          "host" : "FRONB100139",
          "type" : "log4j2",
          "severity" : "INFO",
          "message" : "This is a test message",
          "@timestamp" : "2020-05-08T11:00:34.177Z",
          "app" : "ResponseTimeTest.App",
          "@version" : "1",
          "pid" : "P2116",
          "thread" : "[main]"
        }
      },
      {
        "_index" : "elk-2020.05.08",
        "_type" : "doc",
        "_id" : "z8nH83EBmkihJ9Ihtitp",
        "_score" : 11.739519,
        "_source" : {
          "port" : 58544,
          "uuid" : "30228cd5-5a40-408c-8fb8-b976358d2902",
          "host" : "FRONB100139",
          "type" : "log4j2",
          "severity" : "FATAL",
          "message" : "This is a fatal message",
          "@timestamp" : "2020-05-08T10:14:18.740Z",
          "app" : "LogGenerator.App",
          "@version" : "1",
          "pid" : "P1696",
          "thread" : "[main]"
        }
      },
      {
        "_index" : "elk-2020.05.08",
        "_type" : "doc",
        "_id" : "jb-p83EBmkihJ9IhG5Gl",
        "_score" : 11.231278,
        "_source" : {
          "port" : 57624,
          "uuid" : "0774e4c1-5a40-4eec-b259-db0d17b96436",
          "host" : "FRONB100139",
          "type" : "log4j2",
          "severity" : "INFO",
          "message" : "This is an info message",
          "@timestamp" : "2020-05-08T09:41:13.259Z",
          "app" : "LogGenerator.App",
          "@version" : "1",
          "pid" : "P5448",
          "thread" : "[main]"
        }
      },
      {
        "_index" : "elk-2020.05.08",
        "_type" : "doc",
        "_id" : "876m83EBmkihJ9IhTCe2",
        "_score" : 11.229582,
        "_source" : {
          "port" : 57624,
          "uuid" : "953eb4c4-5a40-4396-986d-0d6498195d8e",
          "host" : "FRONB100139",
          "type" : "log4j2",
          "severity" : "WARN",
          "message" : "This is a warn message",
          "@timestamp" : "2020-05-08T09:37:50.181Z",
          "app" : "LogGenerator.App",
          "@version" : "1",
          "pid" : "P5448",
          "thread" : "[main]"
        }
      },
      {
        "_index" : "elk-2020.05.08",
        "_type" : "doc",
        "_id" : "W7-o83EBmkihJ9IhzmsA",
        "_score" : 11.229582,
        "_source" : {
          "port" : 57624,
          "uuid" : "016d7302-5a40-4a49-83a0-4e1379f0a0eb",
          "host" : "FRONB100139",
          "type" : "log4j2",
          "severity" : "DEBUG",
          "message" : "This is a debug message",
          "@timestamp" : "2020-05-08T09:40:52.707Z",
          "app" : "LogGenerator.App",
          "@version" : "1",
          "pid" : "P5448",
          "thread" : "[main]"
        }
      },
      {
        "_index" : "elk-2020.05.08",
        "_type" : "doc",
        "_id" : "IcO283EBmkihJ9IhP1gn",
        "_score" : 10.642235,
        "_source" : {
          "port" : 58107,
          "uuid" : "496d072b-5a40-43dc-97e6-b50931042faf",
          "host" : "FRONB100139",
          "type" : "log4j2",
          "severity" : "INFO",
          "message" : "This is an info message",
          "@timestamp" : "2020-05-08T09:55:34.687Z",
          "app" : "LogGenerator.App",
          "@version" : "1",
          "pid" : "P10976",
          "thread" : "[main]"
        }
      },
      {
        "_index" : "elk-2020.05.08",
        "_type" : "doc",
        "_id" : "u8S483EBmkihJ9IhMCwU",
        "_score" : 10.642235,
        "_source" : {
          "port" : 58107,
          "uuid" : "d458b480-5a40-4fda-aef4-d798d0c4586a",
          "host" : "FRONB100139",
          "type" : "log4j2",
          "severity" : "WARN",
          "message" : "This is a warn message",
          "@timestamp" : "2020-05-08T09:57:33.206Z",
          "app" : "LogGenerator.App",
          "@version" : "1",
          "pid" : "P10976",
          "thread" : "[main]"
        }
      },
      {
        "_index" : "elk-2020.05.08",
        "_type" : "doc",
        "_id" : "2sW683EBmkihJ9IhMDJr",
        "_score" : 10.642235,
        "_source" : {
          "port" : 58107,
          "uuid" : "f7777871-5a40-45e1-9ab9-c56b343c33ad",
          "host" : "FRONB100139",
          "type" : "log4j2",
          "severity" : "WARN",
          "message" : "This is a warn message",
          "@timestamp" : "2020-05-08T09:59:56.455Z",
          "app" : "LogGenerator.App",
          "@version" : "1",
          "pid" : "P10976",
          "thread" : "[main]"
        }
      },
      {
        "_index" : "elk-2020.05.08",
        "_type" : "doc",
        "_id" : "QMa883EBmkihJ9IhsQGF",
        "_score" : 10.642235,
        "_source" : {
          "port" : 58107,
          "uuid" : "4c248144-5a40-457b-807a-4cb1cd3abc15",
          "host" : "FRONB100139",
          "type" : "log4j2",
          "severity" : "INFO",
          "message" : "This is an info message",
          "@timestamp" : "2020-05-08T10:01:57.118Z",
          "app" : "LogGenerator.App",
          "@version" : "1",
          "pid" : "P10976",
          "thread" : "[main]"
        }
      },
      {
        "_index" : "elk-2020.05.08",
        "_type" : "doc",
        "_id" : "gr-o83EBmkihJ9IhKQ_e",
        "_score" : 9.543183,
        "_source" : {
          "port" : 57624,
          "uuid" : "d4c7dc67-97b4-481f-bd62-67493224de5b",
          "host" : "FRONB100139",
          "type" : "log4j2",
          "severity" : "WARN",
          "message" : "This is a warn message",
          "@timestamp" : "2020-05-08T09:39:58.437Z",
          "app" : "LogGenerator.App",
          "@version" : "1",
          "pid" : "P5448",
          "thread" : "[main]"
        }
      }
    ]
  }
}
Both Kibana search results and Elasticsearch url query returns the same.

Do you know what causes this?
Thank you!