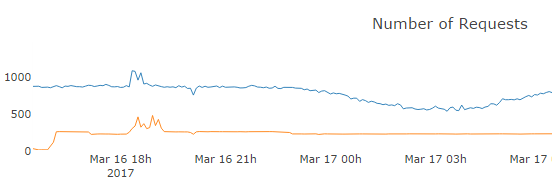
If we disable Kibana again, the request per seconds go down to a normal rate.
The cluster has monitoring set up, but I dont see how that would make any difference.
Why is this happening? I made sure to see if anyone was using Kibana while it was active while we saw this behaviour.
What version of Kibana are you using?
Also, the number of requests will usually increase because you also get Kibana monitoring when you have X-pack installed.
Apache, Apache Lucene, Apache Hadoop, Hadoop, HDFS and the yellow elephant
logo are trademarks of the
Apache Software Foundation
in the United States and/or other countries.