Enrich coordination queue at capacity

I'm currently using the enrich processors to enrich my data coming in. It's been working great however more recently when I increase the indexing rate, I start to get the below error:

[16:47:15] [ELASTIC] Row Error { type: 'es_rejected_execution_exception', reason: 'Could not perform enrichment, enrich coordination queue at capacity [1024/1024]' }

This is concerning because it seems like we're starting to lose data when we do that and we can't have that happen.

How can we best deal with this? Our cluster is a index heavy cluster with every document needing a lookup. We're getting to about 4k-6k events/s with no problem but beyond that we get this error. I don't see any documentation about this. Should we increase the queue capacity somehow? What kind of steps can we take?

Can you post the output from _cluster/stats?pretty please :slight_smile:

{
  "_nodes" : {
    "total" : 4,
    "successful" : 4,
    "failed" : 0
  },
  "cluster_name" : "xxx",
  "cluster_uuid" : "xxx123",
  "timestamp" : 1607469720316,
  "status" : "yellow",
  "indices" : {
    "count" : 478,
    "shards" : {
      "total" : 603,
      "primaries" : 478,
      "replication" : 0.2615062761506276,
      "index" : {
        "shards" : {
          "min" : 1,
          "max" : 2,
          "avg" : 1.2615062761506277
        },
        "primaries" : {
          "min" : 1,
          "max" : 1,
          "avg" : 1.0
        },
        "replication" : {
          "min" : 0.0,
          "max" : 1.0,
          "avg" : 0.2615062761506276
        }
      }
    },
    "docs" : {
      "count" : 65387005,
      "deleted" : 3623690
    },
    "store" : {
      "size_in_bytes" : 32009522560,
      "reserved_in_bytes" : 0
    },
    "fielddata" : {
      "memory_size_in_bytes" : 413488,
      "evictions" : 0
    },
    "query_cache" : {
      "memory_size_in_bytes" : 12518847,
      "total_count" : 21482513,
      "hit_count" : 217525,
      "miss_count" : 21264988,
      "cache_size" : 2294,
      "cache_count" : 2924,
      "evictions" : 630
    },
    "completion" : {
      "size_in_bytes" : 0
    },
    "segments" : {
      "count" : 2378,
      "memory_in_bytes" : 25840592,
      "terms_memory_in_bytes" : 16515456,
      "stored_fields_memory_in_bytes" : 1371224,
      "term_vectors_memory_in_bytes" : 0,
      "norms_memory_in_bytes" : 2167040,
      "points_memory_in_bytes" : 0,
      "doc_values_memory_in_bytes" : 5786872,
      "index_writer_memory_in_bytes" : 23252648,
      "version_map_memory_in_bytes" : 987987,
      "fixed_bit_set_memory_in_bytes" : 12293064,
      "max_unsafe_auto_id_timestamp" : 1607461193284,
      "file_sizes" : { }
    },
    "mappings" : {
      "field_types" : [
        {
          "name" : "binary",
          "count" : 21,
          "index_count" : 5
        },
        {
          "name" : "boolean",
          "count" : 197,
          "index_count" : 53
        },
        {
          "name" : "byte",
          "count" : 1,
          "index_count" : 1
        },
        {
          "name" : "date",
          "count" : 360,
          "index_count" : 104
        },
        {
          "name" : "date_nanos",
          "count" : 1,
          "index_count" : 1
        },
        {
          "name" : "date_range",
          "count" : 1,
          "index_count" : 1
        },
        {
          "name" : "double",
          "count" : 210,
          "index_count" : 210
        },
        {
          "name" : "double_range",
          "count" : 1,
          "index_count" : 1
        },
        {
          "name" : "flattened",
          "count" : 10,
          "index_count" : 2
        },
        {
          "name" : "float",
          "count" : 64,
          "index_count" : 8
        },
        {
          "name" : "float_range",
          "count" : 1,
          "index_count" : 1
        },
        {
          "name" : "geo_point",
          "count" : 15,
          "index_count" : 3
        },
        {
          "name" : "geo_shape",
          "count" : 2,
          "index_count" : 2
        },
        {
          "name" : "half_float",
          "count" : 33,
          "index_count" : 9
        },
        {
          "name" : "integer",
          "count" : 1069,
          "index_count" : 252
        },
        {
          "name" : "integer_range",
          "count" : 1,
          "index_count" : 1
        },
        {
          "name" : "ip",
          "count" : 27,
          "index_count" : 3
        },
        {
          "name" : "ip_range",
          "count" : 1,
          "index_count" : 1
        },
        {
          "name" : "keyword",
          "count" : 7451,
          "index_count" : 474
        },
        {
          "name" : "long",
          "count" : 983,
          "index_count" : 60
        },
        {
          "name" : "long_range",
          "count" : 1,
          "index_count" : 1
        },
        {
          "name" : "nested",
          "count" : 53,
          "index_count" : 14
        },
        {
          "name" : "object",
          "count" : 1366,
          "index_count" : 102
        },
        {
          "name" : "scaled_float",
          "count" : 1,
          "index_count" : 1
        },
        {
          "name" : "shape",
          "count" : 1,
          "index_count" : 1
        },
        {
          "name" : "short",
          "count" : 3,
          "index_count" : 3
        },
        {
          "name" : "text",
          "count" : 5623,
          "index_count" : 279
        }
      ]
    },
    "analysis" : {
      "char_filter_types" : [ ],
      "tokenizer_types" : [
        {
          "name" : "nGram",
          "count" : 2,
          "index_count" : 2
        }
      ],
      "filter_types" : [
        {
          "name" : "pattern_capture",
          "count" : 1,
          "index_count" : 1
        },
        {
          "name" : "word_delimiter",
          "count" : 2,
          "index_count" : 2
        }
      ],
      "analyzer_types" : [
        {
          "name" : "custom",
          "count" : 6,
          "index_count" : 4
        }
      ],
      "built_in_char_filters" : [ ],
      "built_in_tokenizers" : [
        {
          "name" : "keyword",
          "count" : 2,
          "index_count" : 2
        },
        {
          "name" : "lowercase",
          "count" : 1,
          "index_count" : 1
        },
        {
          "name" : "standard",
          "count" : 2,
          "index_count" : 2
        },
        {
          "name" : "uax_url_email",
          "count" : 1,
          "index_count" : 1
        }
      ],
      "built_in_filters" : [
        {
          "name" : "asciifolding",
          "count" : 4,
          "index_count" : 2
        },
        {
          "name" : "lowercase",
          "count" : 5,
          "index_count" : 3
        },
        {
          "name" : "porter_stem",
          "count" : 4,
          "index_count" : 2
        },
        {
          "name" : "unique",
          "count" : 1,
          "index_count" : 1
        }
      ],
      "built_in_analyzers" : [
        {
          "name" : "keyword",
          "count" : 2,
          "index_count" : 2
        }
      ]
    }
  },
  "nodes" : {
    "count" : {
      "total" : 4,
      "coordinating_only" : 0,
      "data" : 2,
      "ingest" : 2,
      "master" : 3,
      "ml" : 1,
      "remote_cluster_client" : 4,
      "transform" : 2,
      "voting_only" : 1
    },
    "versions" : [
      "7.9.3"
    ],
    "os" : {
      "available_processors" : 10,
      "allocated_processors" : 10,
      "names" : [
        {
          "name" : "Linux",
          "count" : 4
        }
      ],
      "pretty_names" : [
        {
          "pretty_name" : "CentOS Linux 7 (Core)",
          "count" : 4
        }
      ],
      "mem" : {
        "total_in_bytes" : 34359738368,
        "free_in_bytes" : 8720740352,
        "used_in_bytes" : 25638998016,
        "free_percent" : 25,
        "used_percent" : 75
      }
    },
    "process" : {
      "cpu" : {
        "percent" : 3
      },
      "open_file_descriptors" : {
        "min" : 334,
        "max" : 1558,
        "avg" : 946
      }
    },
    "jvm" : {
      "max_uptime_in_millis" : 94699440,
      "versions" : [
        {
          "version" : "15",
          "vm_name" : "OpenJDK 64-Bit Server VM",
          "vm_version" : "15+36-1562",
          "vm_vendor" : "Oracle Corporation",
          "bundled_jdk" : true,
          "using_bundled_jdk" : true,
          "count" : 4
        }
      ],
      "mem" : {
        "heap_used_in_bytes" : 8767687904,
        "heap_max_in_bytes" : 17179869184
      },
      "threads" : 249
    },
    "fs" : {
      "total_in_bytes" : 1039382085632,
      "free_in_bytes" : 1005110288384,
      "available_in_bytes" : 1005110288384
    },
    "plugins" : [
      {
        "name" : "repository-s3",
        "version" : "7.9.3",
        "elasticsearch_version" : "7.9.3",
        "java_version" : "1.8",
        "description" : "The S3 repository plugin adds S3 repositories",
        "classname" : "org.elasticsearch.repositories.s3.S3RepositoryPlugin",
        "extended_plugins" : [ ],
        "has_native_controller" : false
      }
    ],
    "network_types" : {
      "transport_types" : {
        "security4" : 4
      },
      "http_types" : {
        "security4" : 4
      }
    },
    "discovery_types" : {
      "zen" : 4
    },
    "packaging_types" : [
      {
        "flavor" : "default",
        "type" : "docker",
        "count" : 4
      }
    ],
    "ingest" : {
      "number_of_pipelines" : 181,
      "processor_stats" : {
        "conditional" : {
          "count" : 0,
          "failed" : 0,
          "current" : 0,
          "time_in_millis" : 0
        },
        "date" : {
          "count" : 19892999,
          "failed" : 156,
          "current" : 0,
          "time_in_millis" : 57064
        },
        "enrich" : {
          "count" : 19892783,
          "failed" : 590,
          "current" : 0,
          "time_in_millis" : 113579590
        },
        "geoip" : {
          "count" : 0,
          "failed" : 0,
          "current" : 0,
          "time_in_millis" : 0
        },
        "grok" : {
          "count" : 0,
          "failed" : 0,
          "current" : 0,
          "time_in_millis" : 0
        },
        "gsub" : {
          "count" : 19892843,
          "failed" : 60,
          "current" : 0,
          "time_in_millis" : 12701
        },
        "remove" : {
          "count" : 481527,
          "failed" : 0,
          "current" : 0,
          "time_in_millis" : 317
        },
        "rename" : {
          "count" : 0,
          "failed" : 0,
          "current" : 0,
          "time_in_millis" : 0
        },
        "script" : {
          "count" : 39784976,
          "failed" : 0,
          "current" : 0,
          "time_in_millis" : 169286
        },
        "set" : {
          "count" : 19892999,
          "failed" : 0,
          "current" : 0,
          "time_in_millis" : 37120
        },
        "split" : {
          "count" : 19892193,
          "failed" : 0,
          "current" : 0,
          "time_in_millis" : 4625
        },
        "unknown" : {
          "count" : 0,
          "failed" : 0,
          "current" : 0,
          "time_in_millis" : 0
        }
      }
    }
  }
}

Wow, that's a lot of ingest pipelines!

When you are indexing at that level, what do other system resources look like - CPU, memory, disk etc? Are you using the inbuilt Monitoring?

Haha yeah, we're doing a different lookup with each different source and we're going to keep adding more.

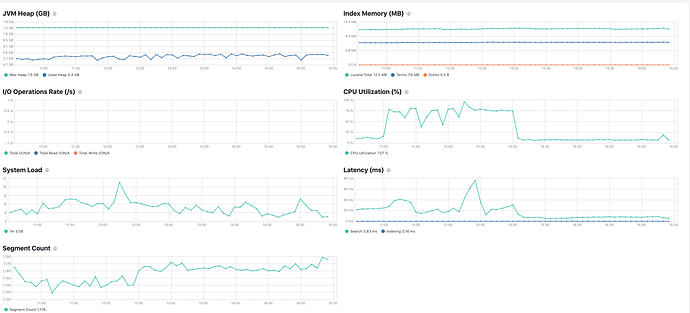
There is monitoring active, is there a page you'd like to see? Here's a graph of the past 5 hours, shows what an ingest period looks like about 3 hours back.

Ok looks like you might be nearing CPU saturation, can you add more to the existing nodes?

Is the queue getting full connected to the CPU usage?

We are thinking of more dedicated masters and/or coordinating nodes. We're on cloud.elastic btw. Would that help?

It's not connected to the CPU, but you are close to hitting limits there anyway so it'd be worth increasing that if you are also looking to add more pipelines.

Adding coordinating nodes would make sense.

We care way more about index speed than query speed. Any way we can dedicate more to indexing so that the queue can get larger (or that it doesn't fill up as quickly)?

What variables can we focus on to prevent this error (if it's not CPU)?

I don't know if you can change that queue to be honest (can't see it in the docs), but the easiest way if you are using ESS is to scale up your cluster size.

Is that because there will be more cores and thus increase the thread pool sizes?

I still don't get what exactly contributes to that error occurring.
Is the event rate causing that ?
Just the sheer number of enrich indices ?
Low memory?

I would like to create some sort of safe guard or cap that will prevent that error essentially (I really don't want to lose any data). Is it that I should do larger bulk commands, and spread it out less?

Typically the queues like this are dynamically created from the CPU core count, so yeah increasing helps all round.

There's a limit on them to stop the nodes becoming overwhelmed with one specific request type (index, search, ingest, etc) at the cost of other parts. It's part memory and part CPU. eg if the bulk requests queue was unbounded, a single huge request could cause an OOM. These are inbuilt so you don't need to worry about creating them.

That said, your ingest process (ie your code) should factor these sorts of responses in and retry when needed. It's standard behaviour from Elasticsearch when it hits these limits.

Ok.

Is there any other settings I can play with to help give more resources to indexing? I've already looked at the documentation for optimizing for indexing speed, but I'm talking more about settings that I can post or edit to elasticseach.yml. (I'm willing to sacrifice query speed)

Any of these for example?

The more work an ingest pipeline need to perform, the longer it will take to process each document and if you are also performing lookups you may add additional load on the cluster as a whole. Increasing the queue size will not improve performance or throughput as the same amount of work still need to be done, but will result in more memory being used to hold data being queued up, potentially making the situation worse. It sounds like you may be reaching the limit of what your current cluster can handle given the current setup so you may need to either simplify the pipelines (perform less work per document) or scale out the cluster (add additional data and/or ingest nodes depending on what monitoring data shows is the limiting resource).

1 Like

Thanks for the thoughful reply @Christian_Dahlqvist. Also @warkolm I appreciate you looking through this with me. Overall the ingest pipelines have been a great addition and I think my use case is really pushing the limits as to what the enrich processor is for. I'll start with adding some coordinating nodes to improve the throughput.

Final question, for this situation, would it be better to add less coordinating nodes with a higher memory, or more nodes with less memory?

1 Like

This topic was automatically closed 28 days after the last reply. New replies are no longer allowed.