Kibana version: 6.8
Elasticsearch version: 6.8
APM Server version: 6.8
APM Agent language and version: Java 8
Browser version: Firefox 66.0.3 (64-bit)
Original install method (e.g. download page, yum, deb, from source, etc.) and version: binary files from elastic.co
Fresh install or upgraded from other version? fresh
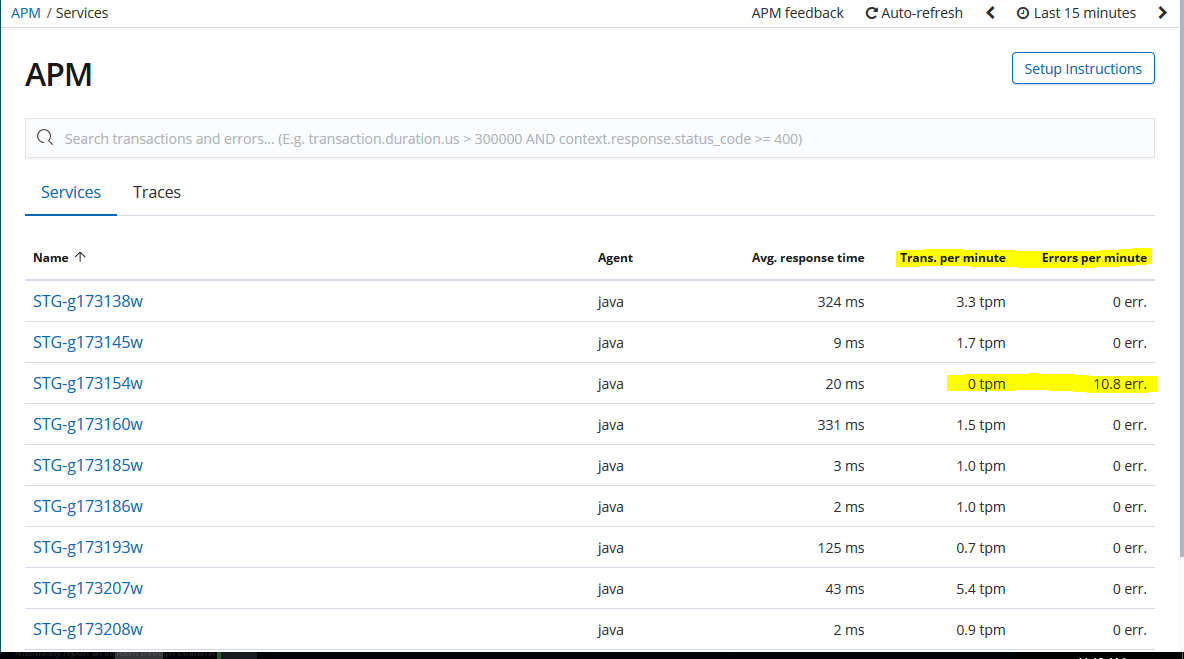
Description of the problem including expected versus actual behavior. Please include screenshots (if relevant):The 'Errors per min' column in APM shows 0 err. even when there are errors in the service. There is one row that shows a certain value for errors per min. but then the trans per min value is shown 0 tpm. even when the transactions can be seen inside. What is this discrepancy between the values shown in the APM front page and the ones seen after looking into a service?
Below is the front page of APM:
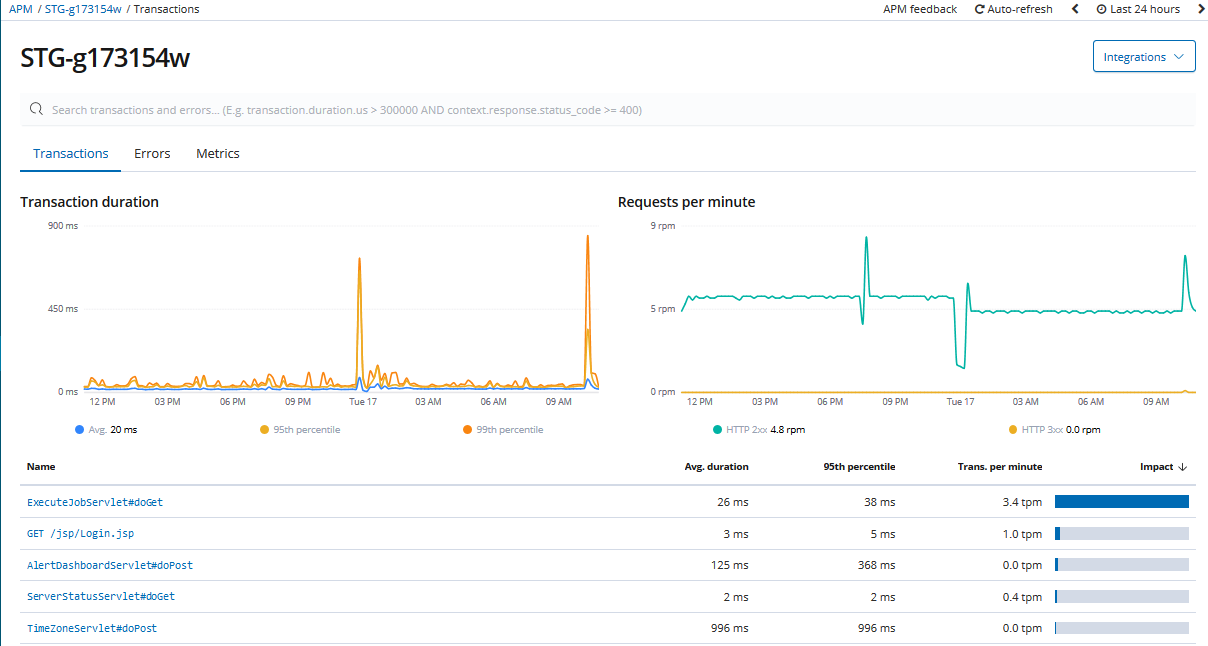
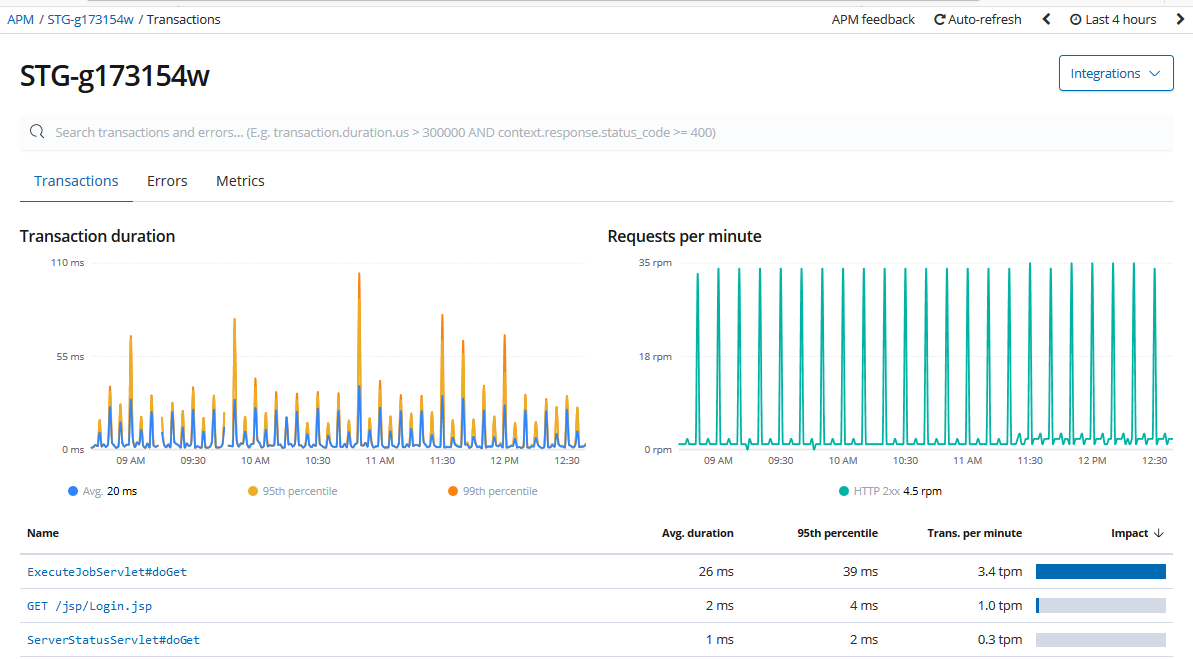
Below is the page of service which showed 0tpm, with transactions listed below:
Below is the page of service which showed 0err, with all the errors listed below: