ES 5.4.1: Totally random cluster stalling (100% CPU) about 1-2 times per day: We're out of ideas

Hi all,

this is a follow-up to the following issue we posted earlier last month: What could make a healthy ES5.3.1 cluster go OOM & unresponsive INSTANTLY?

Setup:

  • Production cluster with 3 pretty large nodes (8Cores/30GiB)
  • Mixed (but pretty consistent) workload of ingest and classic site search with lots of filters, aggregations, etc.
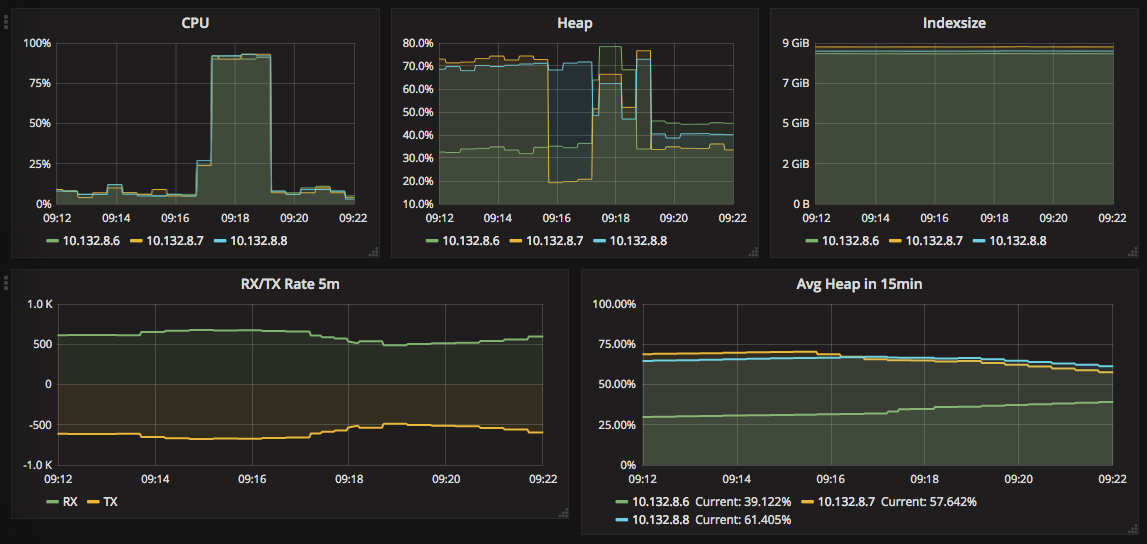
  • Cluster idles around between 5-20% CPU - 99.9% of the time
  • Around 1-2 times per day, the cluster goes completely unresponsive with 100% CPU (mostly Garbage Collecting) for just a few minutes
  • After that, the cluster goes back to normal, queues are emptied and everything is fine.
  • In contrast to the issue referenced above (with more background info inside), the cluster doesn't completely crash anymore, just stall.

What we tried / what it's not:

  • There is no change in quantity or quality of queries during these incidents: We went so far to mirror our production load from the load balancer to the API served by Elastic and ran it again against the cluster: nothing happened.
  • We set all query timeouts for read accesses to 5s and in normal operation, there are virtually no queries running longer than 2s
  • We set all circuit breakers to 1% and they still never trip
  • It's not hardware or noisy neighbors: We're on GCP and rotated the cluster multiple times, even to different machine types in different AZs
  • It's not plugins. The only ones we have are backup repositories and the times don't correlate.
  • It's not ingest related: We regenerated all of our ES documents in a short amount of time and didn't hit the incident.
  • We double / triple checked JVM settings and it's the recommended vanilla production config by ES
  • Downsizing the cluster seemed to increase the events: Half the size lead to about double the amount of these incidents which points to something resource related
  • Out of other sensible ideas, we set up a script to monitor the hot threads every minute, but we didn't find any obvious smoking gun. It just looked busy on the same mix of queries that we have all the time (with the cluster happily crunching through them), but they were simply queued up due to X.

We just don't know what X is.

HELP! :frowning:

Attached are screenshots from such an incident - we also have the hot threads export, but it doesn't fit in here (120kB) and attaching txt files isn't allowed.


Hi Dominik,

sounds familiar to me. How many indices and shards / replicas you have? How often do you create and delete indices (daily / hourly?)

What kind of storage / type of storage you use. Do you use trim function on the OS?

Regards,
Marco

Hi Marco,

we have two indices in this cluster, each has 13 shards (two replicas, each).

Our indices are completely static. We never create / delete them (of course they were created once ...).

We use Google Cloud Platform Block Storage ("PD-SSD", similar to AWS EBS). So far we didn't use TRIM/DISCARD, but we weren't seeing any type of I/O contention either.

Regards,
Dominik

Ok, because of PD-SSD it shouldn't be a I/O problem.

One more question about the static indices: do you make 'write' changes (update/delete/add documents) to the indices? If so, a closer look into merge times ect. may help

Are you monitoring other stats (field data memory, indexing latency, merge latency...) ? More information maybe help to get an idea where the problem is... otherwise it is only guessing :wink:

Regards,
Marco

Yes, we do a lot of updates on these indices. Everything from add, update and delete.

We're monitoring (almost) all metrics ES exports. We'll get back with some numbers later. Thanks so far!

Hi Marco,

thanks for having a look - unfortunately I think most of your suggestions are dead ends :confused:

I've copied you the relevant node stats below: We're updating (-> merging) titles a lot, but an average merge seems to be around 1s and neither indexing nor merging seem to have been throttled much if at all. Field Data Memory is negligible.

There's slightly elevated disk latency and IOPS on the nodes during and shortly before this incident, but nothing we haven't seen during normal operations as well. (See avg. CPU usage graph to locate the stalling incident).

What also baffles me is that there is no other visible clue: We don't have any other active thread pools during these incidents, it's only the search thread pool and queue spiking - which also seems to be a symptom but not the cause (see timing).

Your hint with regards to TRIM / DISCARD was interesting though, we apparently didn't mount the PD-SSD with this setting. Since we've changed that (~20h), we haven't had a stalling incident yet, but due to the spurious nature of this issue, I can't conclude this is solved just yet.

More insights welcome - has anyone else seen this behavior?

"merges": {
    "current": 0,
    "current_docs": 0,
    "current_size_in_bytes": 0,
    "total": 6447,
    "total_time_in_millis": 4475757,
    "total_docs": 66581124,
    "total_size_in_bytes": 30139306820,
    "total_stopped_time_in_millis": 0,
    "total_throttled_time_in_millis": 53936,
    "total_auto_throttle_in_bytes": 442440338
},  
"fielddata": {
    "memory_size_in_bytes": 288376,
    "evictions": 0
},
"indexing": {
    "index_total": 256074,
    "index_time_in_millis": 1354439,
    "index_current": 0,
    "index_failed": 0,
    "delete_total": 0,
    "delete_time_in_millis": 0,
    "delete_current": 0,
    "noop_update_total": 0,
    "is_throttled": false,
    "throttle_time_in_millis": 0
},

We had some trouble with ssd trim in the past which comparable to the effect you described (but we use baremetal systems and not cloud).

Stats seems to be normal to me ... no other ideas at the moment :frowning:

Regards,
Marco

Hi Marco, greetings other fellow Thread Followers,

unfortunately that wasn't it. Cluster didn't stall for about a day, but it's back to the same behavior. Update to 5.4.2 also didn't help. We tried a few more things (mlockall settings, adjust client sided retry/ exp.backoff settings), but nothing helped so far.

Any ideas appreciated.

This topic was automatically closed 28 days after the last reply. New replies are no longer allowed.