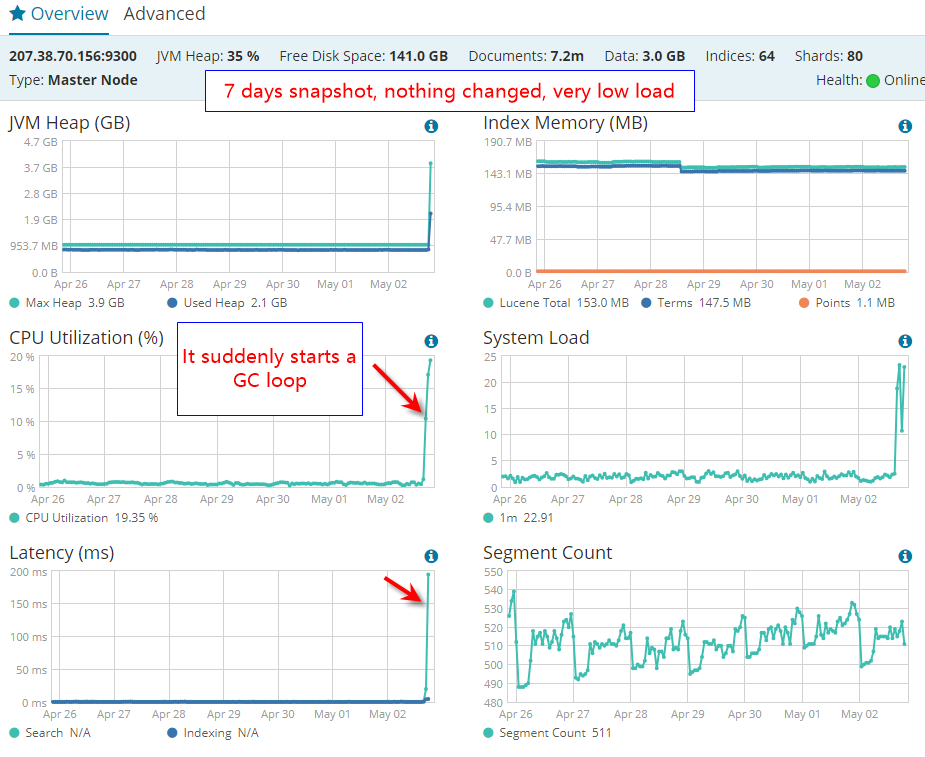
I have a small ES deployment that has been running fine for about 4 months. Today it suddenly start to use up all CPU. No change in query code, no change in traffic load. It just suddenly start to do a lot of GC.
My deployment is really small:
1 node(no cluster), 1 index, 695.4k document, ~ 370mb
index rate ~ 2/s
search rate ~ 5/s
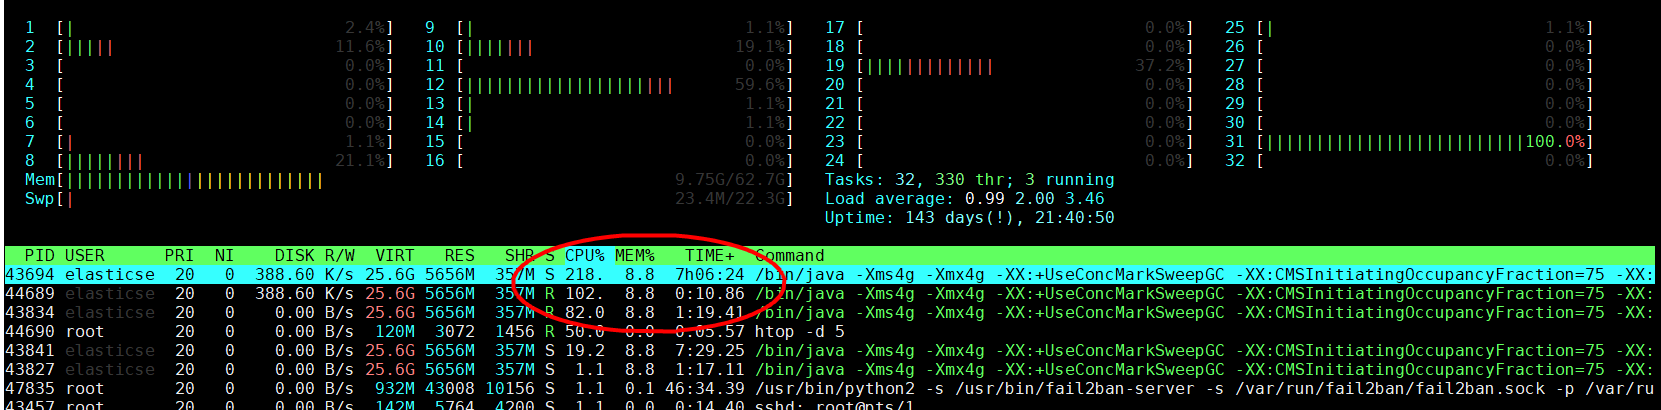
Server:
64GB ram / 50GB free
32 logical cores
It has 1GB heap initially, after seeing GC loop, I changed to 4GB heap and restarted elasticsearch. The problem still there, constant GC loop.
How can I stop this GC loop?
java -version
openjdk version "1.8.0_151"
OpenJDK Runtime Environment (build 1.8.0_151-b12)
OpenJDK 64-Bit Server VM (build 25.151-b12, mixed mode)
[2018-05-02T19:47:38,279][INFO ][o.e.m.j.JvmGcMonitorService] [EEvTfAV] [gc][2826] overhead, spent [340ms] collecting in the last [1s]
[2018-05-02T19:48:49,070][INFO ][o.e.m.j.JvmGcMonitorService] [EEvTfAV] [gc][2896] overhead, spent [357ms] collecting in the last [1.3s]
[2018-05-02T19:49:49,380][INFO ][o.e.m.j.JvmGcMonitorService] [EEvTfAV] [gc][2956] overhead, spent [274ms] collecting in the last [1s]
[2018-05-02T19:51:04,878][INFO ][o.e.m.j.JvmGcMonitorService] [EEvTfAV] [gc][3031] overhead, spent [353ms] collecting in the last [1.3s]
[2018-05-02T19:52:12,135][INFO ][o.e.m.j.JvmGcMonitorService] [EEvTfAV] [gc][3098] overhead, spent [339ms] collecting in the last [1s]
[2018-05-02T19:53:24,666][INFO ][o.e.m.j.JvmGcMonitorService] [EEvTfAV] [gc][3170] overhead, spent [319ms] collecting in the last [1s]
[2018-05-02T19:54:41,886][INFO ][o.e.m.j.JvmGcMonitorService] [EEvTfAV] [gc][3247] overhead, spent [420ms] collecting in the last [1s]


.