ES health

Hi,
I am using below query to check health of ES cluster.

http://localhost:9200/_cat/nodes?v&h=name,version,ip,port,load,ram.max,ram.current,ram.percent,heap.max,heap.current,heap.percent,load_1m,load_5m,uptime,file_desc.max,file_desc.percent,refresh.time,segments.count

name        version  port load ram.max ram.current ram.percent heap.max heap.current heap.percent uptime file_desc.max file_desc.percent refresh.time segments.count 
data-node-1 1.5.2    9300 0.70  31.5gb      31.1gb          61   15.9gb        8.9gb           55   9.7d         65535                86         7.2h          28012 
data-node-3 1.5.2    9300 1.14  31.3gb        31gb          60   15.9gb        6.9gb           43   6.1d         65535                86         4.9h          27998 
data-node-2 1.5.2    9300 0.52  31.3gb      30.9gb          60   15.9gb       10.7gb           67   6.1d         65535                86           4h          28062

Can you please let u know, what parameter should I improve and how?

  1. I frequently get too many open files error and cluster shuts down after that.
    Now there are 86 percent open files? I fear this figure will increase and it will go down,
  2. Heap allocated is 16 GB. Why does it shows ram.percent as 61? it should be 50%
  3. What is segment count? Does it matter for the performance? how to improve this factor?

br,
Sunil

Hey,

  1. you seem to have a fair share of open file descriptors, which usually means a lot of open files, which in turn might mean you have too many shards. That said, the best thing would be to configure file descriptors to be unbounded, but here you might be just hiding another problem.

  2. RAM includes memory used by other processes, it is just telling operating system stats.

  3. Less shards might be an idea - but this is just an assumption without seeing the whole picture.

--Alex

1 Like

I would also recommend upgrading, at least to Elasticsearch 1.7.6.

Hi,

But figures doesn't match for my cluster.

name           version port load ram.max ram.current ram.percent heap.max heap.current heap.percent uptime file_desc.max file_desc.percent refresh.time segments.count 
prod-data-node-1 1.5.2   9300 0.47  31.5gb      31.2gb          61   15.9gb        5.7gb           36  10.5d         65535                86         7.9h          28055 
prod-data-node-3 1.5.2    9300 0.21  31.3gb        31gb          61   15.9gb        4.4gb           27     7d         65535                86         5.7h          28033 
prod-data-node-2 1.5.2    9300 0.39  31.3gb        31gb          61   15.9gb       10.5gb           66     7d         65535                87         4.7h          28176

As per free -m, API should show more than 90% ram.percent because free memory is only 286MB.

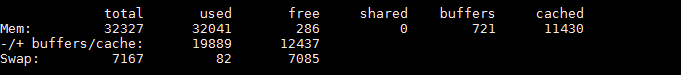
As you can see, there is a huge amount of memory in the cached column, which means it is very likely in use by the linux page cache aka the file system cache. This is the reason why you should only assign a maximum of half of your main memory to the heap.

--Alex

Hi,
file_desc.percent is 87 now.

Is it indication that its going to increase day by day and I have to reduce that. I feer that I will get "too many open files" error very soon, if it increased further and the cluster will be down.

How to control this?

br,
Sunil

How many shards do you have in the cluster?

Hi,

I have 3 node cluster
Each has 32 GB RAM. 16 GB allocated to ES_HEAP

Total shards: 17141
Indices: 2091

Index setting:
3 shards
1 replica
Means total 6 shards per index. This may not match with total shards 17141, because previous setting was different (3 shards, 3 replicas)

br,
Sunil.

17141 shards across 3 nodes is a lot of shards for each node to handle, and explains the large number of file handles used. What is the average shard size?

Some are in GB, and some are in KB

This topic was automatically closed 28 days after the last reply. New replies are no longer allowed.