I've got an ES cluster of two data nodes and one no-data node (serving the
kibana website). It receives approx. 40 mio. loglines a day, and normally
has no issue with this.
If I stop reading in for a short time - and start again -the queue is
emptied about 50x faster than it is filled.
We've had several different issues, and have fixed up nprocs and tuned
elasticsearch.yml - which have helped, but ES (since 1.1.2 - which might
be a coincidence though) suddenly gets an immense slowdown - which makes
the queue fill up. If I then stop everything and restart ES, then LS - it
usually picks back up. Sometimes I have to do it several times.
The only thing that seems to increase in elasticsearch logs, around when
this happens is this message:
[2014-06-22 20:23:02,612][WARN ][transport ]
[p-elasticlog02] Received response for a request that has timed out, sent
[44943ms] ago, timed out [14943ms] ago, action
[discovery/zen/fd/masterPing], node
[[p-elasticlog03][JlyflI1AT6WJHh5fsk311w][p-elasticlog03.example.dk][inet[/10.223.156.18:9300]]{master=true}],
id [23927]
in the second node in the cluster (which seemed to be the cause)
there was GC messages.. and I had to bring down the entire cluster to make
it start running properly again ( I could perhaps just have restarted the
node writing about gc).
I've set nprocs to 4096 and max open files to 65k.
ES is started with: /usr/bin/java -Xms41886M -Xmx41886M
-XX:MaxDirectMemorySize=41886M -Xss256k -Djava.awt.headless=true
-XX:+UseParNewGC -XX:+UseConcMarkSweepGC
-XX:CMSInitiatingOccupancyFraction=75 -XX:+UseCMSInitiatingOccupancyOnly
-XX:+HeapDumpOnOutOfMemoryError
-XX:HeapDumpPath=/var/lib/elasticsearch/heapdump.hprof -Delasticsearch
-Des.pidfile=/var/run/elasticsearch/elasticsearch.pid
-Des.path.home=/usr/share/elasticsearch -cp
:/usr/share/elasticsearch/lib/elasticsearch-1.1.2.jar:/usr/share/elasticsearch/lib/:/usr/share/elasticsearch/lib/sigar/
-Des.default.path.home=/usr/share/elasticsearch
-Des.default.path.logs=/var/log/elasticsearch
-Des.default.path.data=/var/lib/elasticsearch
-Des.default.path.work=/tmp/elasticsearch
-Des.default.path.conf=/etc/elasticsearch
org.elasticsearch.bootstrap.Elasticsearch
Any recommendations as to how I can make try to fix this problem? It
happens a few times a week
It sounds like you are running into GC problems, which is inevitable when
your cluster is at capacity. A few things;
You're running java with a >32GB heap, which will mean your pointers are no
longer compressed and this can/will adversely impact GC.
What ES version are you on, what java version and release, what are your
node specs, how many indexes and how large are they?
Make sure you're monitoring your cluster using plugins like ElasticHQ or
Marvel to give you insight into what is happening.
I've got an ES cluster of two data nodes and one no-data node (serving the
kibana website). It receives approx. 40 mio. loglines a day, and normally
has no issue with this.
If I stop reading in for a short time - and start again -the queue is
emptied about 50x faster than it is filled.
We've had several different issues, and have fixed up nprocs and tuned
elasticsearch.yml - which have helped, but ES (since 1.1.2 - which might
be a coincidence though) suddenly gets an immense slowdown - which makes
the queue fill up. If I then stop everything and restart ES, then LS - it
usually picks back up. Sometimes I have to do it several times.
The only thing that seems to increase in elasticsearch logs, around when
this happens is this message:
[2014-06-22 20:23:02,612][WARN ][transport ]
[p-elasticlog02] Received response for a request that has timed out, sent
[44943ms] ago, timed out [14943ms] ago, action
[discovery/zen/fd/masterPing], node
[[p-elasticlog03][JlyflI1AT6WJHh5fsk311w][p-elasticlog03.example.dk
][inet[/10.223.156.18:9300]]{master=true}], id [23927]
in the second node in the cluster (which seemed to be the cause)
there was GC messages.. and I had to bring down the entire cluster to make
it start running properly again ( I could perhaps just have restarted the
node writing about gc).
I've set nprocs to 4096 and max open files to 65k.
ES is started with: /usr/bin/java -Xms41886M -Xmx41886M
-XX:MaxDirectMemorySize=41886M -Xss256k -Djava.awt.headless=true
-XX:+UseParNewGC -XX:+UseConcMarkSweepGC
-XX:CMSInitiatingOccupancyFraction=75 -XX:+UseCMSInitiatingOccupancyOnly
-XX:+HeapDumpOnOutOfMemoryError
-XX:HeapDumpPath=/var/lib/elasticsearch/heapdump.hprof -Delasticsearch
-Des.pidfile=/var/run/elasticsearch/elasticsearch.pid
-Des.path.home=/usr/share/elasticsearch -cp
:/usr/share/elasticsearch/lib/elasticsearch-1.1.2.jar:/usr/share/elasticsearch/lib/:/usr/share/elasticsearch/lib/sigar/
-Des.default.path.home=/usr/share/elasticsearch
-Des.default.path.logs=/var/log/elasticsearch
-Des.default.path.data=/var/lib/elasticsearch
-Des.default.path.work=/tmp/elasticsearch
-Des.default.path.conf=/etc/elasticsearch
org.elasticsearch.bootstrap.Elasticsearch
Any recommendations as to how I can make try to fix this problem? It
happens a few times a week
ES v1.1.2
openjdk 1.7.0_55
my nodes are 24 core, 64GB memory with SSD disk setup as bcache with
writeback and 8 SATA disks in raid 6 in the back of that.
I have almost no io-wait.
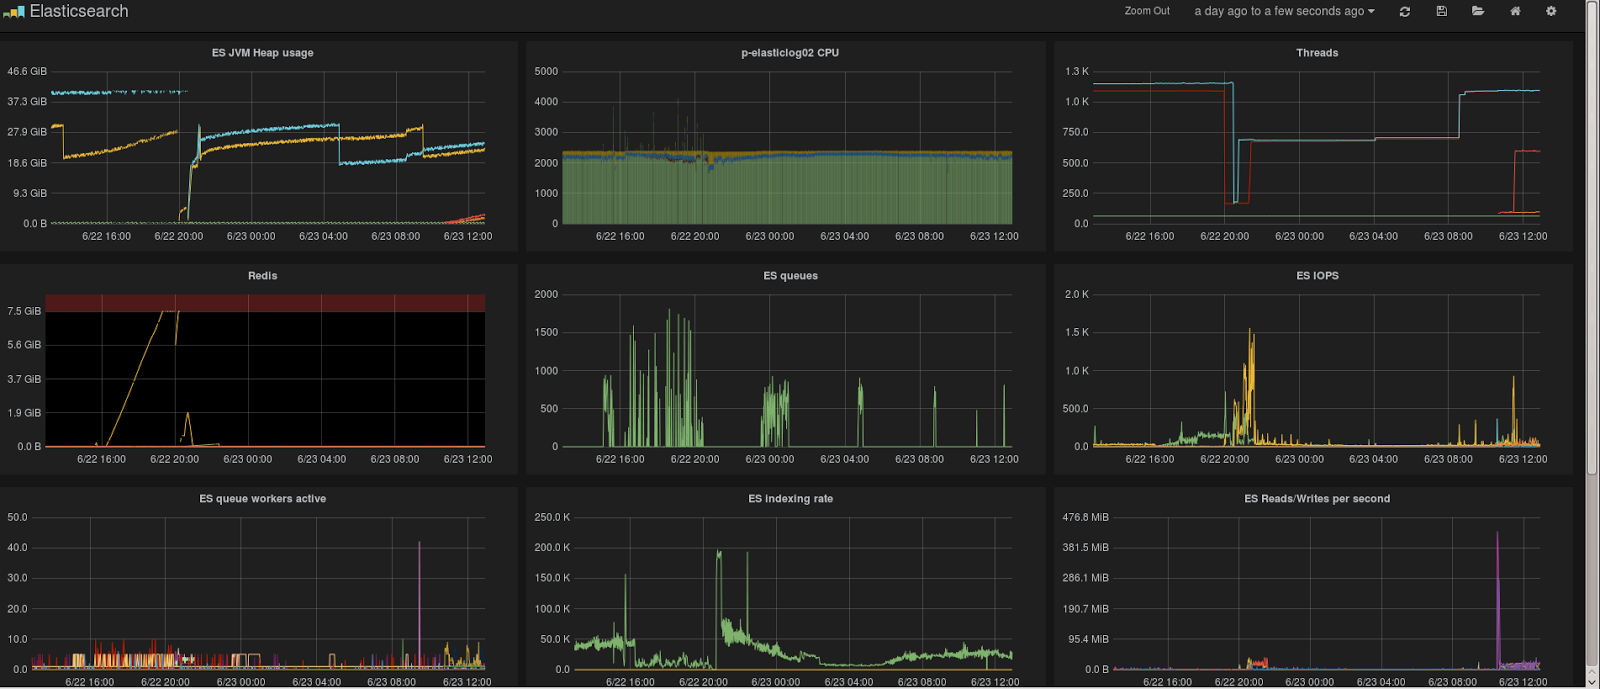
I'm pulling stats using diamond - and have a dashboard setup in grafana -
image attached of when it happened last. The one thing I can see, is that
it happens when ES is at ~37GB Heap usage.
Any numbers in particular I should be looking for?
ES v1.1.2
openjdk 1.7.0_55
my nodes are 24 core, 64GB memory with SSD disk setup as bcache with
writeback and 8 SATA disks in raid 6 in the back of that.
I have almost no io-wait.
I'm pulling stats using diamond - and have a dashboard setup in grafana -
image attached of when it happened last. The one thing I can see, is that
it happens when ES is at ~37GB Heap usage.
Any numbers in particular I should be looking for?
Here's the last 24h - it happened at approx. 16:00 yesterday - and I fixed
it by restarting the cluster at 20:00 (I could have probably just restarted
the node that had written something about GC in its logs..)
Here's the last 24h - it happened at approx. 16:00 yesterday - and I fixed
it by restarting the cluster at 20:00 (I could have probably just restarted
the node that had written something about GC in its logs..)
That's actually quite a lot of data. I'd recommend dropping/closing some
old indexes and/or adding another node, also changing to Oracle java will
give you a bit more breathing room.
Any other changes you could make (eg disable bloom filter) would be minor
and be a diminishing return.
Apache, Apache Lucene, Apache Hadoop, Hadoop, HDFS and the yellow elephant
logo are trademarks of the
Apache Software Foundation
in the United States and/or other countries.
