Ever growing cpu load on cluster nodes

Hi there.

I'm now running a elasticsearch cluster with 5 nodes on java 7 (
jre1.7.0_04 ) using the new G1 garbage collector.
We use the latest version of elasticsearch, 0.19.8

Here's an overview of our setup: http://www.screencast.com/t/wwW6Pcua

I use these java settings:

Java Additional Parameters

wrapper.java.additional.1=-Delasticsearch-service
wrapper.java.additional.2=-Des.path.home=%ES_HOME%
wrapper.java.additional.3=-Xss512k
wrapper.java.additional.4=-XX:+UnlockExperimentalVMOptions
wrapper.java.additional.5=-XX:+UseG1GC
wrapper.java.additional.6=-XX:MaxGCPauseMillis=50
wrapper.java.additional.7=-XX:GCPauseIntervalMillis=100
wrapper.java.additional.8=-XX:SurvivorRatio=16

Initially the nodes run great. Avg. query time is ~ 12ms. But the cpu load
grows slowly, (without affecting the query time) but eventually
overwhelming the cpu at which time the cluster starts freaking out and the
response times grow into the seconds. As a very ugly workaround we simply
recycle the java processes every 12 hours, in a rolling fashion across the
entire cluster. After the restart the cpu usage drops very low for that
node, and then starts to creep up again.

We graph the whole thing with statsd/graphite, here's a bunch of graphs
that show the effect:

process cpu usage: http://www.screencast.com/t/dun2dpNJdPh
heap usage: http://www.screencast.com/t/7DeB2Mqp
gc count: http://www.screencast.com/t/evMK6zUPQm
gc time: http://www.screencast.com/t/9rwv9WxxBfKs

the actual work load doesn't seem related:
query: http://www.screencast.com/t/GgjU3h4d1
index: http://www.screencast.com/t/Ozb1d3qlx

These are ec2 m1.xlarge (16gb ram, 4 cores)

What could cause this? Maybe I'm wrong, but I doesn't look to me like the
garbage collection is to blame here. Compare to some values I've seen with
Java 6 and without G1 these gc counts are very acceptable.

Is it even recommended to run elasticsearch on Java 7? Do you use it with
or without G1?
Are there any best-practice java7 settings someone is willing to share?

Best regards,
Toni

--
Toni,

I'd drop G1. In our tests it hasn't proven to work well. Regarding Java 7

  • we have clients who are using ES with Java 7 without issues.
    You are using -XX:SurvivorRatio=16 on purpose?

Otis

Search Analytics - Cloud Monitoring Tools & Services | Sematext
Scalable Performance Monitoring - Sematext Monitoring | Infrastructure Monitoring Service

On Wednesday, August 15, 2012 9:02:09 AM UTC-4, Toni Birrer wrote:

Hi there.

I'm now running a elasticsearch cluster with 5 nodes on java 7 (
jre1.7.0_04 ) using the new G1 garbage collector.
We use the latest version of elasticsearch, 0.19.8

Here's an overview of our setup: http://www.screencast.com/t/wwW6Pcua

I use these java settings:

Java Additional Parameters

wrapper.java.additional.1=-Delasticsearch-service
wrapper.java.additional.2=-Des.path.home=%ES_HOME%
wrapper.java.additional.3=-Xss512k
wrapper.java.additional.4=-XX:+UnlockExperimentalVMOptions
wrapper.java.additional.5=-XX:+UseG1GC
wrapper.java.additional.6=-XX:MaxGCPauseMillis=50
wrapper.java.additional.7=-XX:GCPauseIntervalMillis=100
wrapper.java.additional.8=-XX:SurvivorRatio=16

Initially the nodes run great. Avg. query time is ~ 12ms. But the cpu load
grows slowly, (without affecting the query time) but eventually
overwhelming the cpu at which time the cluster starts freaking out and the
response times grow into the seconds. As a very ugly workaround we simply
recycle the java processes every 12 hours, in a rolling fashion across the
entire cluster. After the restart the cpu usage drops very low for that
node, and then starts to creep up again.

We graph the whole thing with statsd/graphite, here's a bunch of graphs
that show the effect:

process cpu usage: 2012-08-15_14-42-02.png
heap usage: http://www.screencast.com/t/7DeB2Mqp
gc count: http://www.screencast.com/t/evMK6zUPQm
gc time: http://www.screencast.com/t/9rwv9WxxBfKs

the actual work load doesn't seem related:
query: http://www.screencast.com/t/GgjU3h4d1
index: 2012-08-15_14-57-42.png

These are ec2 m1.xlarge (16gb ram, 4 cores)

What could cause this? Maybe I'm wrong, but I doesn't look to me like the
garbage collection is to blame here. Compare to some values I've seen with
Java 6 and without G1 these gc counts are very acceptable.

Is it even recommended to run elasticsearch on Java 7? Do you use it with
or without G1?
Are there any best-practice java7 settings someone is willing to share?

Best regards,
Toni

--

Thanks for your reply.

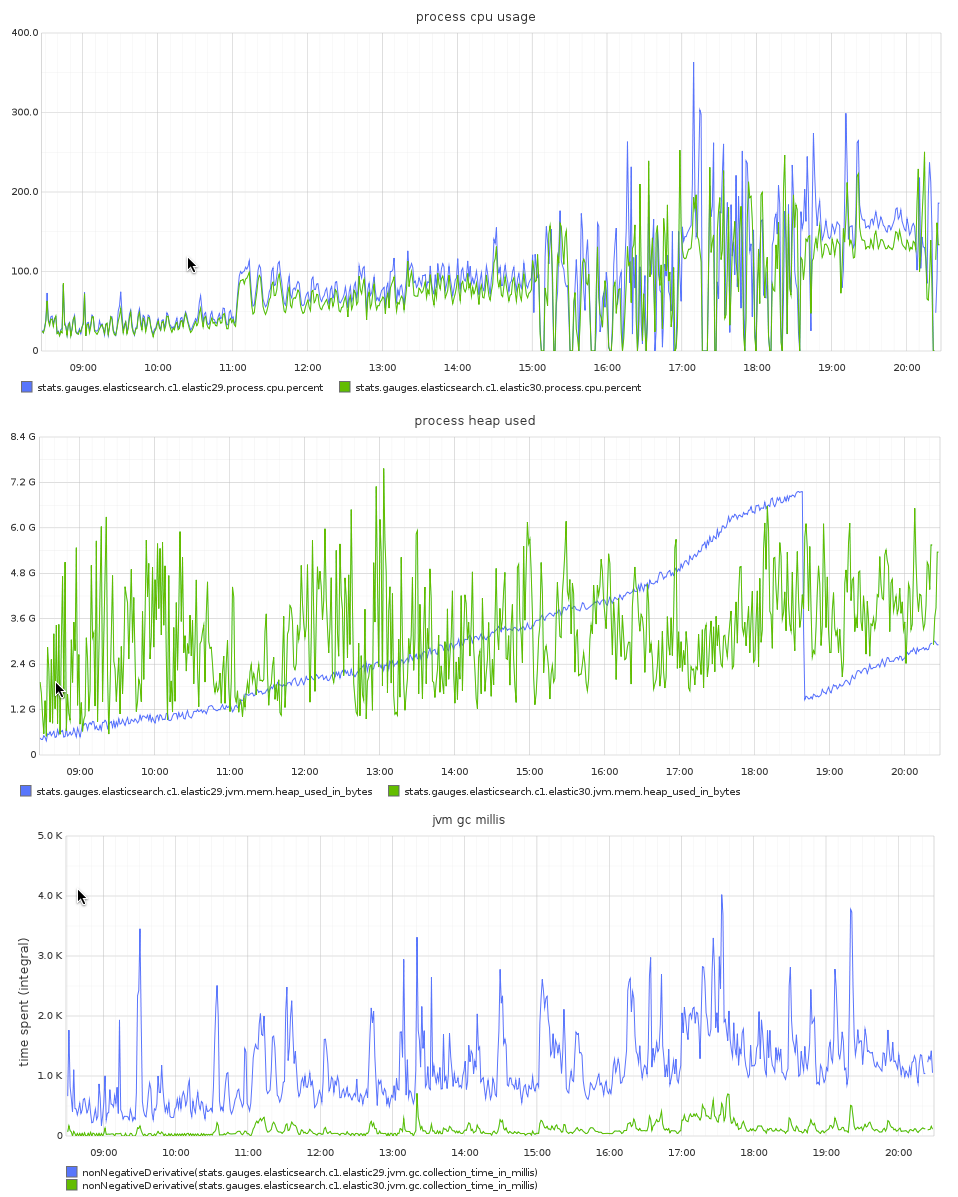
See these graphs for 12 hours of G1 vs Non-G1

I must say i like the G1's results much better.
GC counts and time spent gc'ing are much better, and overal cpu load is
also a tad lower.
The heap usage pattern looks radically different.

Blue Line -> jre7u6 with these settings:
wrapper.java.additional.4=-XX:+UseParNewGC
wrapper.java.additional.5=-XX:+UseConcMarkSweepGC
wrapper.java.additional.6=-XX:CMSInitiatingOccupancyFraction=75
wrapper.java.additional.7=-XX:+UseCMSInitiatingOccupancyOnly
wrapper.java.additional.8=-XX:+HeapDumpOnOutOfMemoryError
wrapper.java.additional.9=-Djava.awt.headless=true

Bigdesk GC stats:
Uptime: 12 hours, 29min
Total time: 860'092ms
Total count: 20'425

Green Line -> jre7u6 with the G1 enabled:
wrapper.java.additional.4=-XX:+UnlockExperimentalVMOptions
wrapper.java.additional.5=-XX:+UseG1GC
wrapper.java.additional.6=-XX:MaxGCPauseMillis=50
wrapper.java.additional.7=-XX:GCPauseIntervalMillis=100
wrapper.java.additional.8=-XX:SurvivorRatio=16
wrapper.java.additional.9=-Djava.awt.headless=true

Bigdesk GC stats:
Uptime: 12 hours, 28min
Total time: 80'736ms
Total count: 1'868

Regarding the SurviverRatio: I've removed it now. It was a leftover from a
test run with a much bigger machine (70GB of RAM) where I tried to limit
the sizes of the surviver spaces.

The thing that bites us right now is that the CPU load is ever increasing
until we restart the java process.
Having to restart ever 12~24 hours can't be normal procedure. Any ideas on
how to identify the cause of this increasing load would be much appreciated.

Regards,
Toni

On Thursday, August 16, 2012 12:53:50 AM UTC+2, Otis Gospodnetic wrote:

Toni,

I'd drop G1. In our tests it hasn't proven to work well. Regarding Java
7 - we have clients who are using ES with Java 7 without issues.
You are using -XX:SurvivorRatio=16 on purpose?

Otis

Search Analytics - Cloud Monitoring Tools & Services | Sematext
Scalable Performance Monitoring - Sematext Monitoring | Infrastructure Monitoring Service

On Wednesday, August 15, 2012 9:02:09 AM UTC-4, Toni Birrer wrote:

Hi there.

I'm now running a elasticsearch cluster with 5 nodes on java 7 (
jre1.7.0_04 ) using the new G1 garbage collector.
We use the latest version of elasticsearch, 0.19.8

Here's an overview of our setup: http://www.screencast.com/t/wwW6Pcua

I use these java settings:

Java Additional Parameters

wrapper.java.additional.1=-Delasticsearch-service
wrapper.java.additional.2=-Des.path.home=%ES_HOME%
wrapper.java.additional.3=-Xss512k
wrapper.java.additional.4=-XX:+UnlockExperimentalVMOptions
wrapper.java.additional.5=-XX:+UseG1GC
wrapper.java.additional.6=-XX:MaxGCPauseMillis=50
wrapper.java.additional.7=-XX:GCPauseIntervalMillis=100
wrapper.java.additional.8=-XX:SurvivorRatio=16

Initially the nodes run great. Avg. query time is ~ 12ms. But the cpu
load grows slowly, (without affecting the query time) but eventually
overwhelming the cpu at which time the cluster starts freaking out and the
response times grow into the seconds. As a very ugly workaround we simply
recycle the java processes every 12 hours, in a rolling fashion across the
entire cluster. After the restart the cpu usage drops very low for that
node, and then starts to creep up again.

We graph the whole thing with statsd/graphite, here's a bunch of graphs
that show the effect:

process cpu usage: 2012-08-15_14-42-02.png
heap usage: http://www.screencast.com/t/7DeB2Mqp
gc count: http://www.screencast.com/t/evMK6zUPQm
gc time: http://www.screencast.com/t/9rwv9WxxBfKs

the actual work load doesn't seem related:
query: http://www.screencast.com/t/GgjU3h4d1
index: 2012-08-15_14-57-42.png

These are ec2 m1.xlarge (16gb ram, 4 cores)

What could cause this? Maybe I'm wrong, but I doesn't look to me like the
garbage collection is to blame here. Compare to some values I've seen with
Java 6 and without G1 these gc counts are very acceptable.

Is it even recommended to run elasticsearch on Java 7? Do you use it with
or without G1?
Are there any best-practice java7 settings someone is willing to share?

Best regards,
Toni

--

What is the query load on the cluster, do you query with Java API, Node
Client or TransportClient? Remote or on same machine? As I can observe
similar patterns - slow growing CPU cycles over the time - and I could not
locate the cause yet I would like to stay tuned on this topic.

Best regards,

Jörg

On Thursday, August 16, 2012 8:56:12 PM UTC+2, Toni Birrer wrote:

Thanks for your reply.

See these graphs for 12 hours of G1 vs Non-G1

http://content.screencast.com/users/tonibirrer/folders/Default/media/b480a173-0a7c-487d-8d9d-504c2c491ac5/graph.png

I must say i like the G1's results much better.
GC counts and time spent gc'ing are much better, and overal cpu load is
also a tad lower.
The heap usage pattern looks radically different.

Blue Line -> jre7u6 with these settings:
wrapper.java.additional.4=-XX:+UseParNewGC
wrapper.java.additional.5=-XX:+UseConcMarkSweepGC
wrapper.java.additional.6=-XX:CMSInitiatingOccupancyFraction=75
wrapper.java.additional.7=-XX:+UseCMSInitiatingOccupancyOnly
wrapper.java.additional.8=-XX:+HeapDumpOnOutOfMemoryError
wrapper.java.additional.9=-Djava.awt.headless=true

Bigdesk GC stats:
Uptime: 12 hours, 29min
Total time: 860'092ms
Total count: 20'425

Green Line -> jre7u6 with the G1 enabled:
wrapper.java.additional.4=-XX:+UnlockExperimentalVMOptions
wrapper.java.additional.5=-XX:+UseG1GC
wrapper.java.additional.6=-XX:MaxGCPauseMillis=50
wrapper.java.additional.7=-XX:GCPauseIntervalMillis=100
wrapper.java.additional.8=-XX:SurvivorRatio=16
wrapper.java.additional.9=-Djava.awt.headless=true

Bigdesk GC stats:
Uptime: 12 hours, 28min
Total time: 80'736ms
Total count: 1'868

Regarding the SurviverRatio: I've removed it now. It was a leftover from a
test run with a much bigger machine (70GB of RAM) where I tried to limit
the sizes of the surviver spaces.

The thing that bites us right now is that the CPU load is ever increasing
until we restart the java process.
Having to restart ever 12~24 hours can't be normal procedure. Any ideas on
how to identify the cause of this increasing load would be much appreciated.

Regards,
Toni

On Thursday, August 16, 2012 12:53:50 AM UTC+2, Otis Gospodnetic wrote:

Toni,

I'd drop G1. In our tests it hasn't proven to work well. Regarding Java
7 - we have clients who are using ES with Java 7 without issues.
You are using -XX:SurvivorRatio=16 on purpose?

Otis

Search Analytics - Cloud Monitoring Tools & Services | Sematext
Scalable Performance Monitoring - Sematext Monitoring | Infrastructure Monitoring Service

On Wednesday, August 15, 2012 9:02:09 AM UTC-4, Toni Birrer wrote:

Hi there.

I'm now running a elasticsearch cluster with 5 nodes on java 7 (
jre1.7.0_04 ) using the new G1 garbage collector.
We use the latest version of elasticsearch, 0.19.8

Here's an overview of our setup: http://www.screencast.com/t/wwW6Pcua

I use these java settings:

Java Additional Parameters

wrapper.java.additional.1=-Delasticsearch-service
wrapper.java.additional.2=-Des.path.home=%ES_HOME%
wrapper.java.additional.3=-Xss512k
wrapper.java.additional.4=-XX:+UnlockExperimentalVMOptions
wrapper.java.additional.5=-XX:+UseG1GC
wrapper.java.additional.6=-XX:MaxGCPauseMillis=50
wrapper.java.additional.7=-XX:GCPauseIntervalMillis=100
wrapper.java.additional.8=-XX:SurvivorRatio=16

Initially the nodes run great. Avg. query time is ~ 12ms. But the cpu
load grows slowly, (without affecting the query time) but eventually
overwhelming the cpu at which time the cluster starts freaking out and the
response times grow into the seconds. As a very ugly workaround we simply
recycle the java processes every 12 hours, in a rolling fashion across the
entire cluster. After the restart the cpu usage drops very low for that
node, and then starts to creep up again.

We graph the whole thing with statsd/graphite, here's a bunch of graphs
that show the effect:

process cpu usage: 2012-08-15_14-42-02.png
heap usage: http://www.screencast.com/t/7DeB2Mqp
gc count: http://www.screencast.com/t/evMK6zUPQm
gc time: http://www.screencast.com/t/9rwv9WxxBfKs

the actual work load doesn't seem related:
query: http://www.screencast.com/t/GgjU3h4d1
index: 2012-08-15_14-57-42.png

These are ec2 m1.xlarge (16gb ram, 4 cores)

What could cause this? Maybe I'm wrong, but I doesn't look to me like
the garbage collection is to blame here. Compare to some values I've seen
with Java 6 and without G1 these gc counts are very acceptable.

Is it even recommended to run elasticsearch on Java 7? Do you use it
with or without G1?
Are there any best-practice java7 settings someone is willing to share?

Best regards,
Toni

--

Hi Jörg.

Here is some current graphs that show activity vs. cpu load vs. query time
over the last 48 hours.

We peak out at about 300 calls per second... since we're not in public beta
yet, index and query are pretty equal still.

The current architecture looks like this:
http://www.screencast.com/t/svmvE51S2j6c

We have 3 'balancer' nodes in the front, that don't have any shards, but
only handle the traffic and act as masters.
In the back we have 3 worker nodes which hold the shards. Replica level is
2 to each node currently holds the entire index.

The cpu load on the 'balancer' nodes is pretty much flat, but on the worker
it goes up from ~40% to ~150% (these machines have 4 cpus) in ~8 hours.
The troubling part is that during that same timeframe, the average query
response time goes also up from ~20ms to ~30ms.

I'm not the developer, but AFAIK we use the REST API directly, using the
python requests library.
And our app are on dedicated servers. The elasticsearch servers only run
elasticsearch.

In the graphs you can see the restarts we do...e.g. one node at a time
starting at 8:00. Whats interesting is that in some cases the cpu load of
all three nodes comes down after the first node is restarted.

On Monday, August 20, 2012 3:10:46 PM UTC+2, Jörg Prante wrote:

What is the query load on the cluster, do you query with Java API, Node
Client or TransportClient? Remote or on same machine? As I can observe
similar patterns - slow growing CPU cycles over the time - and I could not
locate the cause yet I would like to stay tuned on this topic.

Best regards,

Jörg

On Thursday, August 16, 2012 8:56:12 PM UTC+2, Toni Birrer wrote:

Thanks for your reply.

See these graphs for 12 hours of G1 vs Non-G1

http://content.screencast.com/users/tonibirrer/folders/Default/media/b480a173-0a7c-487d-8d9d-504c2c491ac5/graph.png

I must say i like the G1's results much better.
GC counts and time spent gc'ing are much better, and overal cpu load is
also a tad lower.
The heap usage pattern looks radically different.

Blue Line -> jre7u6 with these settings:
wrapper.java.additional.4=-XX:+UseParNewGC
wrapper.java.additional.5=-XX:+UseConcMarkSweepGC
wrapper.java.additional.6=-XX:CMSInitiatingOccupancyFraction=75
wrapper.java.additional.7=-XX:+UseCMSInitiatingOccupancyOnly
wrapper.java.additional.8=-XX:+HeapDumpOnOutOfMemoryError
wrapper.java.additional.9=-Djava.awt.headless=true

Bigdesk GC stats:
Uptime: 12 hours, 29min
Total time: 860'092ms
Total count: 20'425

Green Line -> jre7u6 with the G1 enabled:
wrapper.java.additional.4=-XX:+UnlockExperimentalVMOptions
wrapper.java.additional.5=-XX:+UseG1GC
wrapper.java.additional.6=-XX:MaxGCPauseMillis=50
wrapper.java.additional.7=-XX:GCPauseIntervalMillis=100
wrapper.java.additional.8=-XX:SurvivorRatio=16
wrapper.java.additional.9=-Djava.awt.headless=true

Bigdesk GC stats:
Uptime: 12 hours, 28min
Total time: 80'736ms
Total count: 1'868

Regarding the SurviverRatio: I've removed it now. It was a leftover from
a test run with a much bigger machine (70GB of RAM) where I tried to limit
the sizes of the surviver spaces.

The thing that bites us right now is that the CPU load is ever increasing
until we restart the java process.
Having to restart ever 12~24 hours can't be normal procedure. Any ideas
on how to identify the cause of this increasing load would be
much appreciated.

Regards,
Toni

On Thursday, August 16, 2012 12:53:50 AM UTC+2, Otis Gospodnetic wrote:

Toni,

I'd drop G1. In our tests it hasn't proven to work well. Regarding
Java 7 - we have clients who are using ES with Java 7 without issues.
You are using -XX:SurvivorRatio=16 on purpose?

Otis

Search Analytics - Cloud Monitoring Tools & Services | Sematext
Scalable Performance Monitoring - Sematext Monitoring | Infrastructure Monitoring Service

On Wednesday, August 15, 2012 9:02:09 AM UTC-4, Toni Birrer wrote:

Hi there.

I'm now running a elasticsearch cluster with 5 nodes on java 7 (
jre1.7.0_04 ) using the new G1 garbage collector.
We use the latest version of elasticsearch, 0.19.8

Here's an overview of our setup: http://www.screencast.com/t/wwW6Pcua

I use these java settings:

Java Additional Parameters

wrapper.java.additional.1=-Delasticsearch-service
wrapper.java.additional.2=-Des.path.home=%ES_HOME%
wrapper.java.additional.3=-Xss512k
wrapper.java.additional.4=-XX:+UnlockExperimentalVMOptions
wrapper.java.additional.5=-XX:+UseG1GC
wrapper.java.additional.6=-XX:MaxGCPauseMillis=50
wrapper.java.additional.7=-XX:GCPauseIntervalMillis=100
wrapper.java.additional.8=-XX:SurvivorRatio=16

Initially the nodes run great. Avg. query time is ~ 12ms. But the cpu
load grows slowly, (without affecting the query time) but eventually
overwhelming the cpu at which time the cluster starts freaking out and the
response times grow into the seconds. As a very ugly workaround we simply
recycle the java processes every 12 hours, in a rolling fashion across the
entire cluster. After the restart the cpu usage drops very low for that
node, and then starts to creep up again.

We graph the whole thing with statsd/graphite, here's a bunch of graphs
that show the effect:

process cpu usage: 2012-08-15_14-42-02.png
heap usage: http://www.screencast.com/t/7DeB2Mqp
gc count: http://www.screencast.com/t/evMK6zUPQm
gc time: http://www.screencast.com/t/9rwv9WxxBfKs

the actual work load doesn't seem related:
query: http://www.screencast.com/t/GgjU3h4d1
index: 2012-08-15_14-57-42.png

These are ec2 m1.xlarge (16gb ram, 4 cores)

What could cause this? Maybe I'm wrong, but I doesn't look to me like
the garbage collection is to blame here. Compare to some values I've seen
with Java 6 and without G1 these gc counts are very acceptable.

Is it even recommended to run elasticsearch on Java 7? Do you use it
with or without G1?
Are there any best-practice java7 settings someone is willing to share?

Best regards,
Toni

--