Hi all,
I'm testing a full Elastic Stack installation (v.7.6.0) and it seems Kibana web server ("node") is not trying to exploit at best the available cores on the server where it is up and running.
Looking at the CPU load with the Linux system tool ("top", "htop", ecc) while Kibana is running what happens seems to be:
-
at Kibana start time there are 1+10 processes running (1 parent and 10 children) as you can see in the following figure:
-
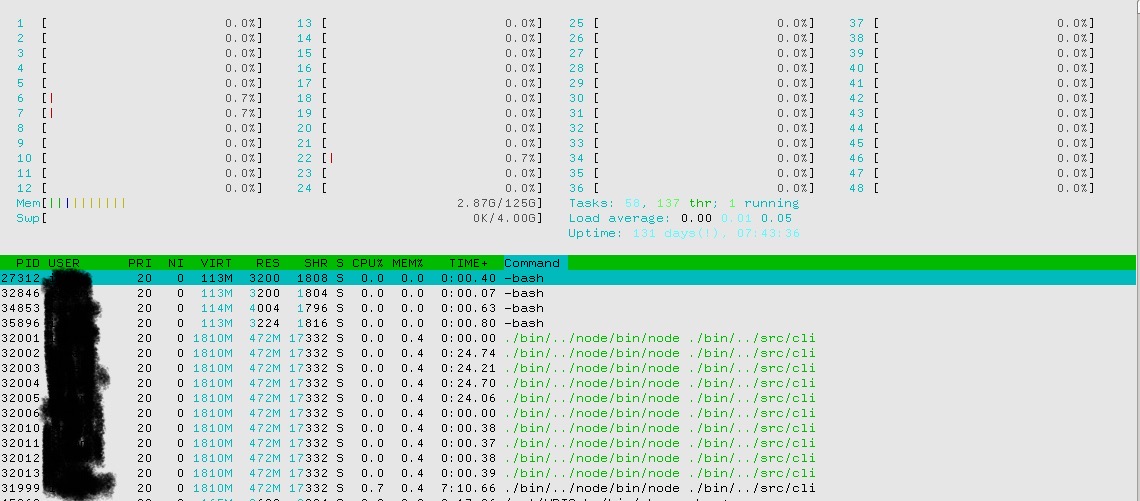
then I start a stress test (using Jmeter) that sends (with a low throughput) requests to Kibana. Immediately the CPU load changes: the parent goes up more than 100% CPU; 4 children slowly take from 3 to 4 CPU percentage, and nothing else about the 6 others children (they stay at 0.0%). In the next capture image you can see the first threads ordered by CPU% running while the stresstest:
So, in order to force Kibana to use and exploit all its 10 children, I repeat the stress test sending requests with a very huge throughput. But the load of the "node" processes doesn't change as you can see:
Obviously the average response time of the stress test become very high and Kibana is not usable anymore by a web browser (along the stress test) because becomes unresponsive.
Why Kibana doesn't try to exploit all the hardware resources?
What I'm missing?
Is there a way to increase the number of threads the "node" could use?
Thanks in advance for any comments/hints.
Best regards
Hello,
Kibana is constituted by a server part running in NodeJS, plus a frontend part (the UI).
While I cannot see the screenshots, I bet Kibana spawns several sub-processes at the first startup because it performs some optimizations on the bundles which will be served (some css and jscode packaged with webpack).
What endpoint are you targeting on JMeter to stress test Kibana?
In order to evaluate the performances of Kibana you probably want some automated test (e.g. selenium) in order to verify when the data will be shown on the browser.
If you instead are interested in benchmarking Elasticsearch, you might take a look at ES-Rally.
Hi Luca,
first thanks so much for your comments and hints about performance test tools.
Hi updated the topic with screenshots showing the processes running on the server so the issue is clearer.
The test directly sends requests to Kibana UI Url (default port 5601), I prepared special set of POST URL in order to let Kibana accept and serve requests.
Is a configuration point there where I could change the way the server part in NodeJS works?
It seems it is not able to exploit all the cores available on the server (while it is clear elastic cluster nodes do!)... that would be weird and not good at all.
And if Kibana (in its UI server component) can scale using more than one CPU core, how could I set the max number of requests serving threads?
Thanks again for any further comments to you and to anyone else who want to add a contribution to this topic (that would be very welcome  )
)
Hi all,
any other comments, suggestions or hints on this topic?
I'm very surpirised about the lack of replies 
Is it a topic that have interest just tome only?
Thanks in advance.
What I can say is Kibana is highly io bound (as it is "translation" layer between frontend requests and requests being done toward Elasticsearch.
I hope a Kibana developer might enlighten you more.
The other approach might be to configure multiple Kibana instances behind a load balancer / reverse proxy.