So with 7.9 elastic brought support for Sophos FW I quickly updated everything and started shipping logs using filebeat and everything seems to be working fine except 1 thing which is events from alert.kind: alert are generated when the fw detects malware in files which means it should show up on the external alerts widget in the SIEM app but it isn’t showing up there.
Hi Ameer, thanks for your post.
Let's try to find out why your Sophos FW alerts are not showing up in the external alerts widgets. I do not currently have access to Sophos logs to verify this behavior, so I am referencing the current documentation for the Filebeat Sophos Module here: https://www.elastic.co/guide/en/beats/filebeat/7.9/filebeat-module-sophos.html
First, I noticed that you mentioned alert.kind: alert, but I think you mean event.kind: alert, is this correct?
Next, there are three places in the 7.9 security app where the external alerts widget is used, and each has a slightly different query associated with it.
-
Overview -> External alerts: We expect that all events with
event.kind: alertto show up here. -
Hosts->External alerts: Only external alerts that also include the
host.namefield will appear here. Generally, we would not expect network firewall alerts to be displayed in this instance of the External alerts widget. -
Network->External alerts: External alerts that contain an IP address in the
source.ipfield will be displayed. I would expect your FW alerts to show up here.
Can you clarify if your FW alerts appear in any of the three locations?
Also, can you verify whether you can see these FW Alerts elsewhere in the Security app, or elsewhere in Kibana, such as in Discover?

Clicking the request magnifier glass next to the query:
!
Screen Shot 2020-08-31 at 9.57.44 AM|690x490
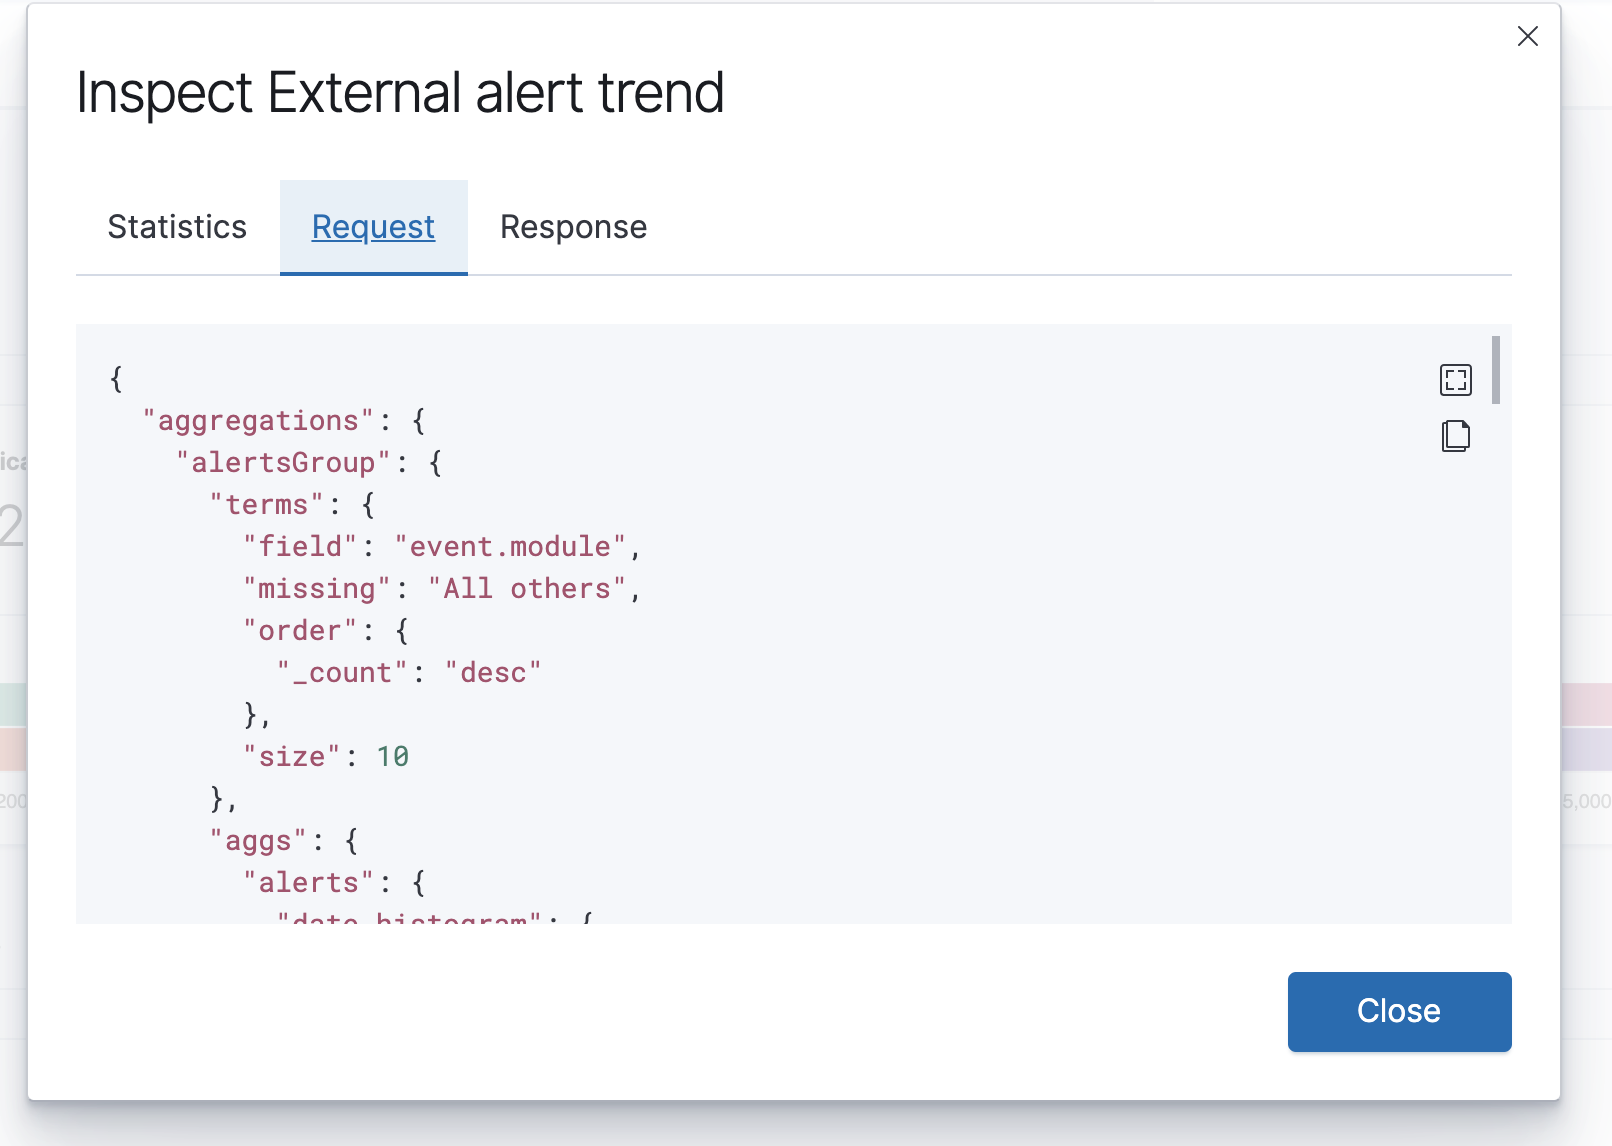
I see this query below. Do you have host.name in your events? :
{
  "aggregations": {
    "alertsGroup": {
      "terms": {
        "field": "event.module",
        "missing": "All others",
        "order": {
          "_count": "desc"
        },
        "size": 10
      },
      "aggs": {
        "alerts": {
          "date_histogram": {
            "field": "@timestamp",
            "fixed_interval": "2700000ms",
            "min_doc_count": 0,
            "extended_bounds": {
              "min": 1598802998148,
              "max": 1598889398148
            }
          }
        }
      }
    }
  },
  "query": {
    "bool": {
      "filter": [
        {
          "bool": {
            "must": [],
            "filter": [
              {
                "match_all": {}
              },
              {
                "bool": {
                  "filter": [
                    {
                      "bool": {
                        "should": [
                          {
                            "exists": {
                              "field": "host.name"
                            }
                          }
                        ],
                        "minimum_should_match": 1
                      }
                    }
                  ]
                }
              }
            ],
            "should": [],
            "must_not": []
          }
        },
        {
          "bool": {
            "filter": [
              {
                "bool": {
                  "should": [
                    {
                      "match": {
                        "event.kind": "alert"
                      }
                    }
                  ],
                  "minimum_should_match": 1
                }
              }
            ]
          }
        },
        {
          "range": {
            "@timestamp": {
              "gte": "2020-08-30T15:56:38.148Z",
              "lte": "2020-08-31T15:56:38.148Z",
              "format": "strict_date_optional_time"
            }
          }
        }
      ]
    }
  },
  "size": 0,
  "track_total_hits": true
}