Good afternoon,
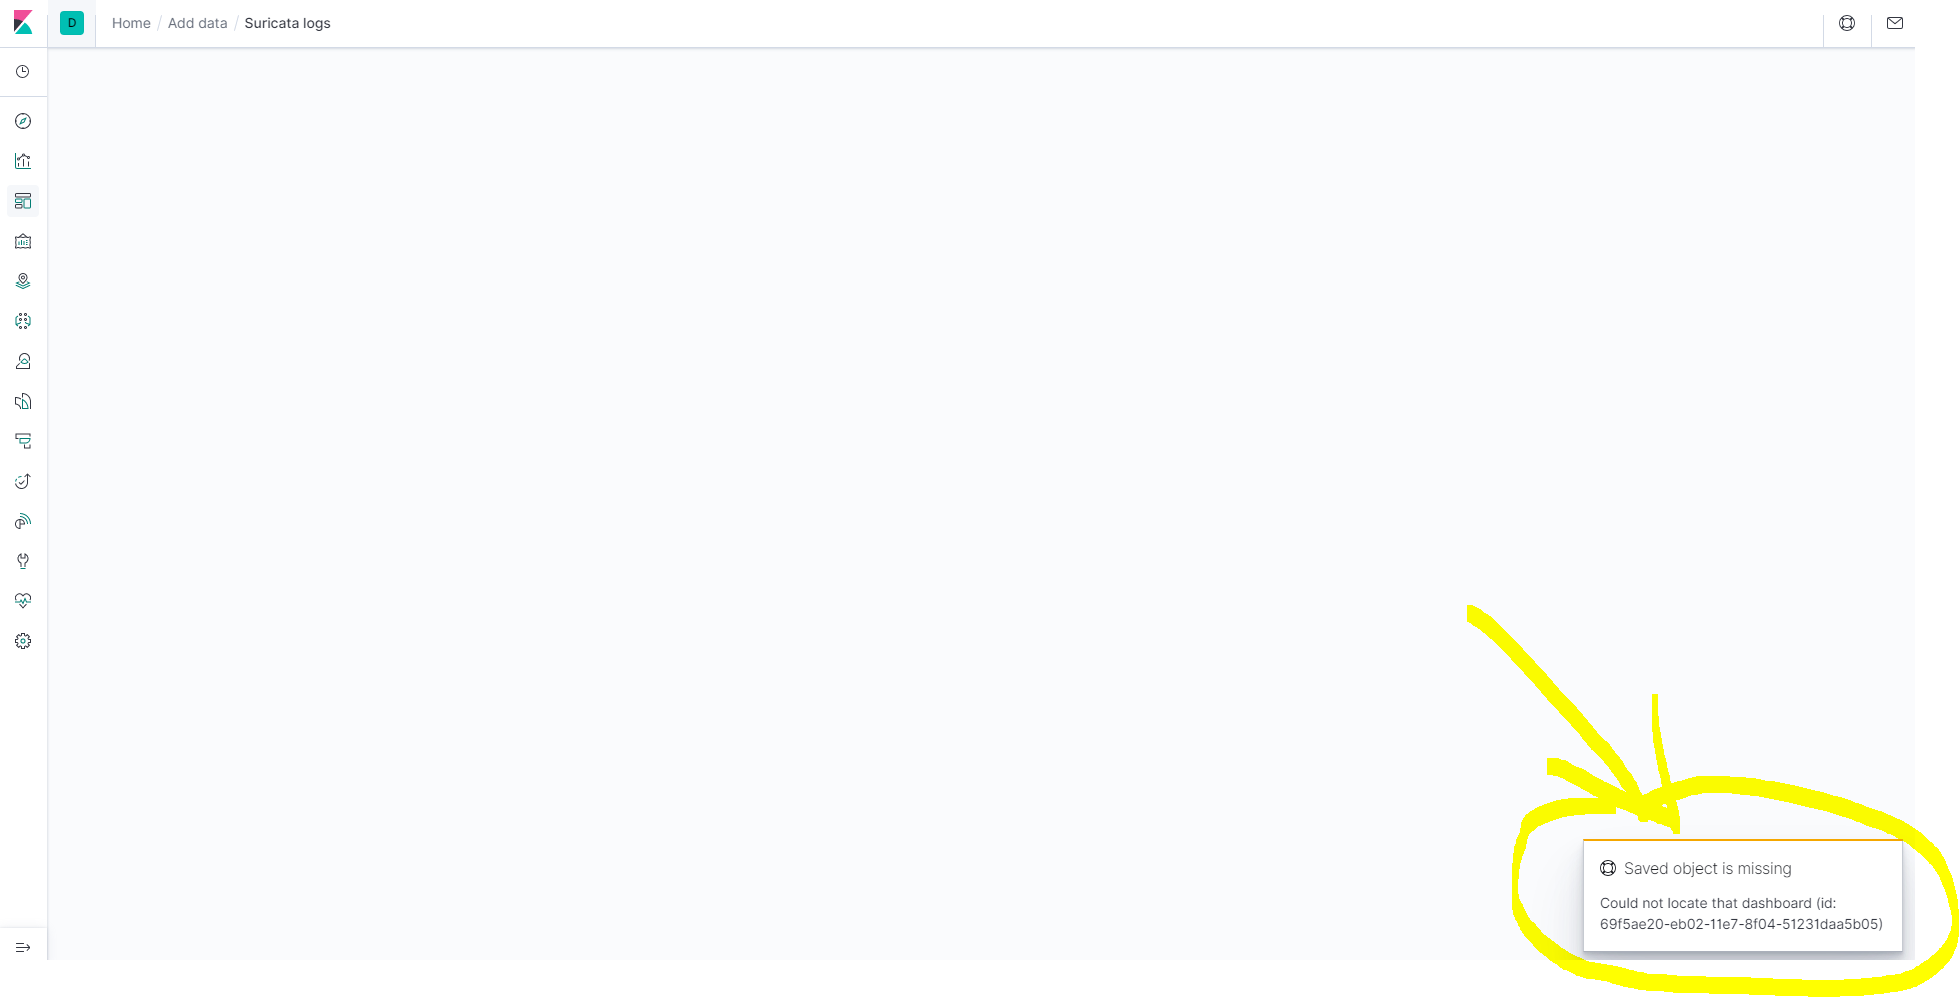
I leave this post because in my ELK 7.6 I get the error you see below when loading the Meerkat Dashboard (the one that comes in the Stack) some idea of where the problem can go.
Thank you very much for the help!
Could you give a bit more information? Is this a new installation, did you upgrade? How did you trigger that error?
It looks like you may be running filebeat collection without having run ./filebeat setup. That setup step creates dashboards in Kibana. If you run it now, do you see it working?
./filebeat at Suricata Server or ELK server?
From wherever you are currently running ./filebeat
Sorry but I don't quite understand it ./filebeat in Suricata does nothing to me ...
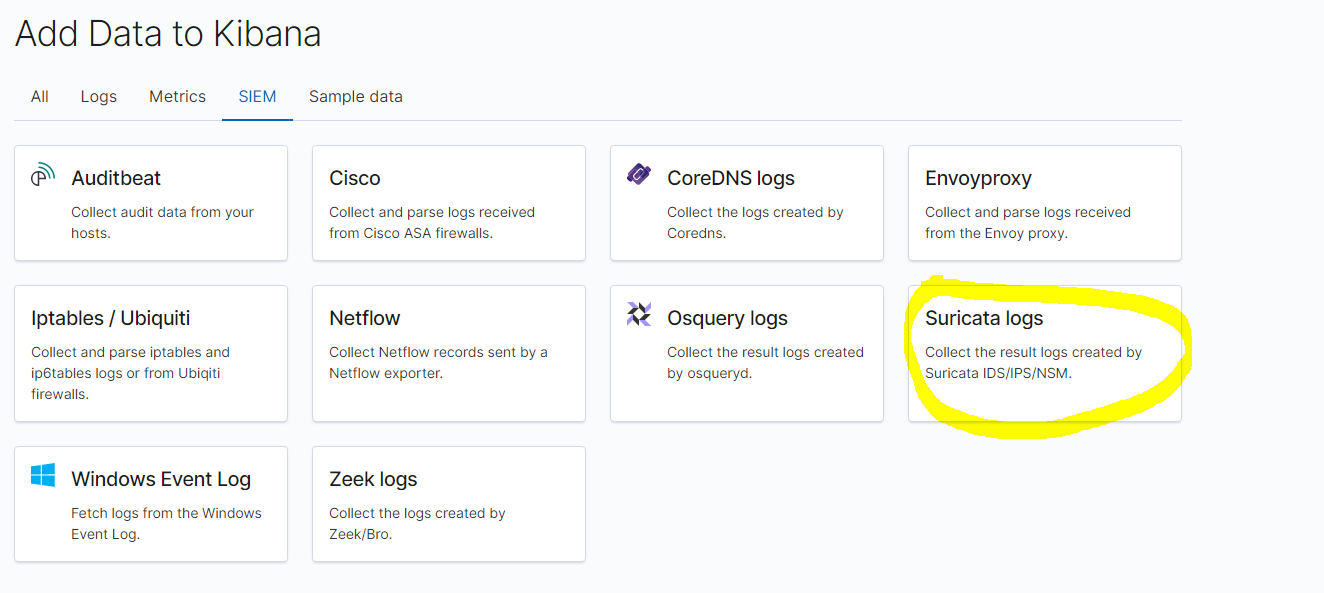
Okay, the screenshots show that you are using filebeat to send data from Suricata to Elasticsearch. To set up the Kibana dashboards, you need to run the filebeat setup command on the command line, from the same place filebeat is installed.
For testing I have put the lines so that filebeat pulls the data to elasticsearch directly without going through logstash and I get what you see below in the capture, in any case when I launch it to logstash then it processes it to elasticsearch because indexes are created elasticsearch takes movement.
Greetings!
/etc/logstash/logstash.yml
/etc/logstash/conf.d/logstash.conf
/etc/logstash/conf.d/suricata.conf
I can't help you with your filebeat setup, but I can tell you that this is the source of the original problem you asked about. Without running filebeat setup successfully, you will not see the dashboards that you are expecting.
For filebeat questions, please ask in https://discuss.elastic.co/c/beats/28
© 2020. All Rights Reserved - Elasticsearch
Apache, Apache Lucene, Apache Hadoop, Hadoop, HDFS and the yellow elephant logo are trademarks of the Apache Software Foundation in the United States and/or other countries.