Here it is :
{
"cluster_name": "cluster",
"nodes": {
"G9QD__pjSX6EEAgf0-R6DA": {
"timestamp": 1394541121431,
"name": "Rachel Grey",
"transport_address": "inet[/10.16.75.4:9300]",
"host": "esnode2",
"ip": [
"inet[/10.16.75.4:9300]",
"NONE"
],
"indices": {
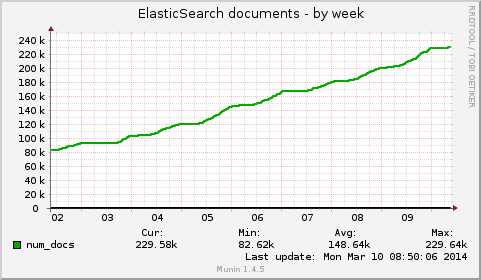
"docs": {
"count": 267760,
"deleted": 27
},
"store": {
"size_in_bytes": 117169306,
"throttle_time_in_millis": 529910
},
"indexing": {
"index_total": 72967,
"index_time_in_millis": 680811,
"index_current": 0,
"delete_total": 3361,
"delete_time_in_millis": 350,
"delete_current": 0
},
"get": {
"total": 0,
"time_in_millis": 0,
"exists_total": 0,
"exists_time_in_millis": 0,
"missing_total": 0,
"missing_time_in_millis": 0,
"current": 0
},
"search": {
"open_contexts": 0,
"query_total": 1867521,
"query_time_in_millis": 24867921,
"query_current": 0,
"fetch_total": 513026,
"fetch_time_in_millis": 448526,
"fetch_current": 0
},
"merges": {
"current": 0,
"current_docs": 0,
"current_size_in_bytes": 0,
"total": 172,
"total_time_in_millis": 297808,
"total_docs": 1616101,
"total_size_in_bytes": 480732242
},
"refresh": {
"total": 11450,
"total_time_in_millis": 559302
},
"flush": {
"total": 217,
"total_time_in_millis": 4368
},
"warmer": {
"current": 0,
"total": 12265,
"total_time_in_millis": 28495
},
"filter_cache": {
"memory_size_in_bytes": 2501878,
"evictions": 0
},
"id_cache": {
"memory_size_in_bytes": 0
},
"fielddata": {
"memory_size_in_bytes": 2048898,
"evictions": 0
},
"percolate": {
"total": 15659,
"time_in_millis": 33899,
"current": 0,
"memory_size_in_bytes": 50602805,
"memory_size": "48.2mb",
"queries": 5
},
"completion": {
"size_in_bytes": 0
},
"segments": {
"count": 46,
"memory_in_bytes": 3048144
},
"translog": {
"operations": 289,
"size_in_bytes": 0
}
},
"os": {
"timestamp": 1394541121435,
"uptime_in_millis": 19092151,
"load_average": [
1.1,
0.67,
0.61
],
"cpu": {
"sys": 0,
"user": 23,
"idle": 76,
"usage": 23,
"stolen": 0
},
"mem": {
"free_in_bytes": 5992665088,
"used_in_bytes": 10874990592,
"free_percent": 71,
"used_percent": 28,
"actual_free_in_bytes": 12106989568,
"actual_used_in_bytes": 4760666112
},
"swap": {
"used_in_bytes": 0,
"free_in_bytes": 0
}
},
"process": {
"timestamp": 1394541121435,
"open_file_descriptors": 160,
"cpu": {
"percent": 46,
"sys_in_millis": 323580,
"user_in_millis": 27690580,
"total_in_millis": 28014160
},
"mem": {
"resident_in_bytes": 1591611392,
"share_in_bytes": 34516992,
"total_virtual_in_bytes": 2852478976
}
},
"jvm": {
"timestamp": 1394541121435,
"uptime_in_millis": 89061753,
"mem": {
"heap_used_in_bytes": 1237602520,
"heap_used_percent": 58,
"heap_committed_in_bytes": 2130051072,
"heap_max_in_bytes": 2130051072,
"non_heap_used_in_bytes": 54024912,
"non_heap_committed_in_bytes": 54394880,
"pools": {
"young": {
"used_in_bytes": 8136992,
"max_in_bytes": 139591680,
"peak_used_in_bytes": 139591680,
"peak_max_in_bytes": 139591680
},
"survivor": {
"used_in_bytes": 1696352,
"max_in_bytes": 17432576,
"peak_used_in_bytes": 17432576,
"peak_max_in_bytes": 17432576
},
"old": {
"used_in_bytes": 1227771384,
"max_in_bytes": 1973026816,
"peak_used_in_bytes": 1227771384,
"peak_max_in_bytes": 1973026816
}
}
},
"threads": {
"count": 48,
"peak_count": 56
},
"gc": {
"collectors": {
"young": {
"collection_count": 4300,
"collection_time_in_millis": 64401
},
"old": {
"collection_count": 0,
"collection_time_in_millis": 0
}
}
},
"buffer_pools": {
"direct": {
"count": 34,
"used_in_bytes": 7728976,
"total_capacity_in_bytes": 7728976
},
"mapped": {
"count": 96,
"used_in_bytes": 110742186,
"total_capacity_in_bytes": 110742186
}
}
},
"thread_pool": {
"generic": {
"threads": 1,
"queue": 0,
"active": 0,
"rejected": 0,
"largest": 7,
"completed": 11331
},
"index": {
"threads": 2,
"queue": 0,
"active": 0,
"rejected": 0,
"largest": 2,
"completed": 45015
},
"get": {
"threads": 0,
"queue": 0,
"active": 0,
"rejected": 0,
"largest": 0,
"completed": 0
},
"snapshot": {
"threads": 1,
"queue": 0,
"active": 0,
"rejected": 0,
"largest": 1,
"completed": 5408
},
"merge": {
"threads": 1,
"queue": 0,
"active": 0,
"rejected": 0,
"largest": 1,
"completed": 11882
},
"suggest": {
"threads": 0,
"queue": 0,
"active": 0,
"rejected": 0,
"largest": 0,
"completed": 0
},
"bulk": {
"threads": 2,
"queue": 0,
"active": 0,
"rejected": 0,
"largest": 2,
"completed": 5760
},
"optimize": {
"threads": 0,
"queue": 0,
"active": 0,
"rejected": 0,
"largest": 0,
"completed": 0
},
"warmer": {
"threads": 1,
"queue": 0,
"active": 0,
"rejected": 0,
"largest": 1,
"completed": 12265
},
"flush": {
"threads": 1,
"queue": 0,
"active": 0,
"rejected": 0,
"largest": 1,
"completed": 217
},
"search": {
"threads": 6,
"queue": 0,
"active": 0,
"rejected": 0,
"largest": 6,
"completed": 2380681
},
"percolate": {
"threads": 2,
"queue": 0,
"active": 0,
"rejected": 0,
"largest": 2,
"completed": 15659
},
"management": {
"threads": 5,
"queue": 0,
"active": 1,
"rejected": 0,
"largest": 5,
"completed": 11655
},
"refresh": {
"threads": 1,
"queue": 0,
"active": 0,
"rejected": 0,
"largest": 1,
"completed": 11465
}
},
"network": {
"tcp": {
"active_opens": 82783,
"passive_opens": 28208795,
"curr_estab": 54,
"in_segs": 2351809120,
"out_segs": 3873742660,
"retrans_segs": 3506870,
"estab_resets": 103778,
"attempt_fails": 62,
"in_errs": 0,
"out_rsts": 2437332
}
},
"fs": {
"timestamp": 1394541121436,
"total": {
"total_in_bytes": 82566774784,
"free_in_bytes": 76417433600,
"available_in_bytes": 75578605568,
"disk_reads": 71744,
"disk_writes": 43233820,
"disk_io_op": 43305564,
"disk_read_size_in_bytes": 4594340864,
"disk_write_size_in_bytes": 889864847360,
"disk_io_size_in_bytes": 894459188224,
"disk_queue": "0",
"disk_service_time": "0"
},
"data": [
{
"path": "/home/elasticsearch/nodes/0",
"mount": "/",
"dev": "/dev/vda2",
"total_in_bytes": 82566774784,
"free_in_bytes": 76417433600,
"available_in_bytes": 75578605568,
"disk_reads": 71744,
"disk_writes": 43233820,
"disk_io_op": 43305564,
"disk_read_size_in_bytes": 4594340864,
"disk_write_size_in_bytes": 889864847360,
"disk_io_size_in_bytes": 894459188224,
"disk_queue": "0",
"disk_service_time": "0"
}
]
},
"transport": {
"server_open": 26,
"rx_count": 4037863,
"rx_size_in_bytes": 1371158333,
"tx_count": 4036008,
"tx_size_in_bytes": 597805806
},
"http": {
"current_open": 1,
"total_opened": 104527
},
"fielddata_breaker": {
"maximum_size_in_bytes": 1704040857,
"maximum_size": "1.5gb",
"estimated_size_in_bytes": 796577361,
"estimated_size": "759.6mb",
"overhead": 1.03
}
},
"UaZqZ9h5T5ey0dla2KJVSA": {
"timestamp": 1394541121431,
"name": "Martin Preston",
"transport_address": "inet[/10.16.75.3:9300]",
"host": "esnode1",
"ip": [
"inet[/10.16.75.3:9300]",
"NONE"
],
"indices": {
"docs": {
"count": 267760,
"deleted": 24
},
"store": {
"size_in_bytes": 117222009,
"throttle_time_in_millis": 1721395
},
"indexing": {
"index_total": 79162,
"index_time_in_millis": 57805,
"index_current": 0,
"delete_total": 3952,
"delete_time_in_millis": 421,
"delete_current": 0
},
"get": {
"total": 0,
"time_in_millis": 0,
"exists_total": 0,
"exists_time_in_millis": 0,
"missing_total": 0,
"missing_time_in_millis": 0,
"current": 0
},
"search": {
"open_contexts": 0,
"query_total": 2058451,
"query_time_in_millis": 576948,
"query_current": 0,
"fetch_total": 572130,
"fetch_time_in_millis": 94208,
"fetch_current": 0
},
"merges": {
"current": 0,
"current_docs": 0,
"current_size_in_bytes": 0,
"total": 165,
"total_time_in_millis": 60725,
"total_docs": 1542764,
"total_size_in_bytes": 438737516
},
"refresh": {
"total": 12852,
"total_time_in_millis": 83257
},
"flush": {
"total": 245,
"total_time_in_millis": 3188
},
"warmer": {
"current": 0,
"total": 13792,
"total_time_in_millis": 3157
},
"filter_cache": {
"memory_size_in_bytes": 2688417,
"evictions": 0
},
"id_cache": {
"memory_size_in_bytes": 0
},
"fielddata": {
"memory_size_in_bytes": 2231386,
"evictions": 0
},
"percolate": {
"total": 18387,
"time_in_millis": 20124,
"current": 0,
"memory_size_in_bytes": 36587613,
"memory_size": "34.8mb",
"queries": 5
},
"completion": {
"size_in_bytes": 0
},
"segments": {
"count": 50,
"memory_in_bytes": 3049789
},
"translog": {
"operations": 286,
"size_in_bytes": 0
}
},
"os": {
"timestamp": 1394541121432,
"uptime_in_millis": 12456460,
"load_average": [
0.12,
0.11,
0.13
],
"cpu": {
"sys": 2,
"user": 7,
"idle": 90,
"usage": 9,
"stolen": 0
},
"mem": {
"free_in_bytes": 7124275200,
"used_in_bytes": 9743380480,
"free_percent": 70,
"used_percent": 29,
"actual_free_in_bytes": 11817607168,
"actual_used_in_bytes": 5050048512
},
"swap": {
"used_in_bytes": 0,
"free_in_bytes": 0
}
},
"process": {
"timestamp": 1394541121432,
"open_file_descriptors": 160,
"cpu": {
"percent": 3,
"sys_in_millis": 325200,
"user_in_millis": 2488790,
"total_in_millis": 2813990
},
"mem": {
"resident_in_bytes": 1869119488,
"share_in_bytes": 36052992,
"total_virtual_in_bytes": 2848534528
}
},
"jvm": {
"timestamp": 1394541121432,
"uptime_in_millis": 100005398,
"mem": {
"heap_used_in_bytes": 356969744,
"heap_used_percent": 16,
"heap_committed_in_bytes": 2130051072,
"heap_max_in_bytes": 2130051072,
"non_heap_used_in_bytes": 52893472,
"non_heap_committed_in_bytes": 80510976,
"pools": {
"young": {
"used_in_bytes": 17767016,
"max_in_bytes": 139591680,
"peak_used_in_bytes": 139591680,
"peak_max_in_bytes": 139591680
},
"survivor": {
"used_in_bytes": 2333592,
"max_in_bytes": 17432576,
"peak_used_in_bytes": 17432576,
"peak_max_in_bytes": 17432576
},
"old": {
"used_in_bytes": 336869136,
"max_in_bytes": 1973026816,
"peak_used_in_bytes": 1480030232,
"peak_max_in_bytes": 1973026816
}
}
},
"threads": {
"count": 50,
"peak_count": 56
},
"gc": {
"collectors": {
"young": {
"collection_count": 6166,
"collection_time_in_millis": 87399
},
"old": {
"collection_count": 2,
"collection_time_in_millis": 220
}
}
},
"buffer_pools": {
"direct": {
"count": 31,
"used_in_bytes": 8299659,
"total_capacity_in_bytes": 8299659
},
"mapped": {
"count": 100,
"used_in_bytes": 110804161,
"total_capacity_in_bytes": 110804161
}
}
},
"thread_pool": {
"generic": {
"threads": 2,
"queue": 0,
"active": 0,
"rejected": 0,
"largest": 7,
"completed": 16018
},
"index": {
"threads": 2,
"queue": 0,
"active": 0,
"rejected": 0,
"largest": 2,
"completed": 46342
},
"get": {
"threads": 0,
"queue": 0,
"active": 0,
"rejected": 0,
"largest": 0,
"completed": 0
},
"snapshot": {
"threads": 1,
"queue": 0,
"active": 0,
"rejected": 0,
"largest": 1,
"completed": 6074
},
"merge": {
"threads": 1,
"queue": 0,
"active": 0,
"rejected": 0,
"largest": 1,
"completed": 12779
},
"suggest": {
"threads": 0,
"queue": 0,
"active": 0,
"rejected": 0,
"largest": 0,
"completed": 0
},
"bulk": {
"threads": 2,
"queue": 0,
"active": 0,
"rejected": 0,
"largest": 2,
"completed": 6719
},
"optimize": {
"threads": 0,
"queue": 0,
"active": 0,
"rejected": 0,
"largest": 0,
"completed": 0
},
"warmer": {
"threads": 1,
"queue": 0,
"active": 0,
"rejected": 0,
"largest": 1,
"completed": 13792
},
"flush": {
"threads": 1,
"queue": 0,
"active": 0,
"rejected": 0,
"largest": 1,
"completed": 245
},
"search": {
"threads": 6,
"queue": 0,
"active": 0,
"rejected": 0,
"largest": 6,
"completed": 2630669
},
"percolate": {
"threads": 2,
"queue": 0,
"active": 0,
"rejected": 0,
"largest": 2,
"completed": 18387
},
"management": {
"threads": 5,
"queue": 0,
"active": 1,
"rejected": 0,
"largest": 5,
"completed": 18982
},
"refresh": {
"threads": 1,
"queue": 0,
"active": 0,
"rejected": 0,
"largest": 1,
"completed": 12852
}
},
"network": {
"tcp": {
"active_opens": 82615,
"passive_opens": 53213294,
"curr_estab": 56,
"in_segs": 3681090099,
"out_segs": 3892966411,
"retrans_segs": 6630780,
"estab_resets": 68154,
"attempt_fails": 13,
"in_errs": 0,
"out_rsts": 1353371
}
},
"fs": {
"timestamp": 1394541121433,
"total": {
"total_in_bytes": 82566774784,
"free_in_bytes": 77825974272,
"available_in_bytes": 76987146240,
"disk_reads": 123047,
"disk_writes": 29374819,
"disk_io_op": 29497866,
"disk_read_size_in_bytes": 7861359616,
"disk_write_size_in_bytes": 652959784960,
"disk_io_size_in_bytes": 660821144576,
"disk_queue": "0",
"disk_service_time": "0"
},
"data": [
{
"path": "/home/elasticsearch/nodes/0",
"mount": "/",
"dev": "/dev/vda2",
"total_in_bytes": 82566774784,
"free_in_bytes": 77825974272,
"available_in_bytes": 76987146240,
"disk_reads": 123047,
"disk_writes": 29374819,
"disk_io_op": 29497866,
"disk_read_size_in_bytes": 7861359616,
"disk_write_size_in_bytes": 652959784960,
"disk_io_size_in_bytes": 660821144576,
"disk_queue": "0",
"disk_service_time": "0"
}
]
},
"transport": {
"server_open": 26,
"rx_count": 4449489,
"rx_size_in_bytes": 728136464,
"tx_count": 4449864,
"tx_size_in_bytes": 1509918122
},
"http": {
"current_open": 1,
"total_opened": 7569
},
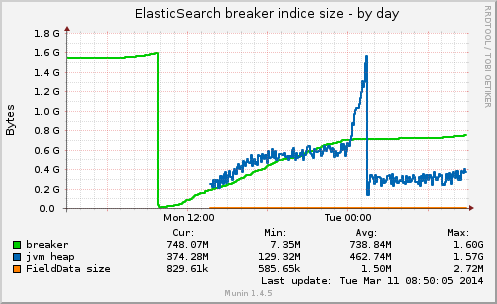
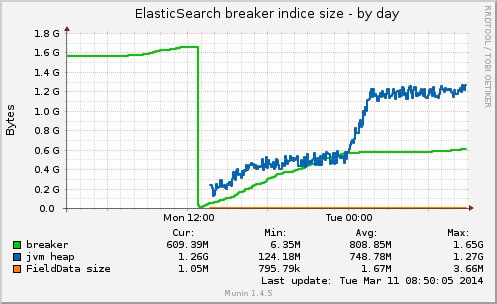
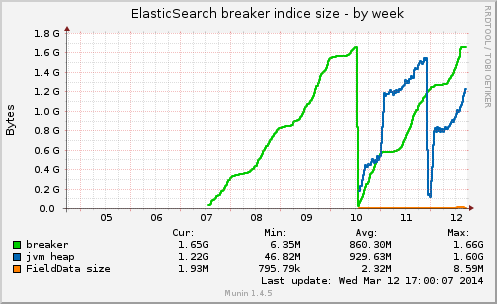
"fielddata_breaker": {
"maximum_size_in_bytes": 1704040857,
"maximum_size": "1.5gb",
"estimated_size_in_bytes": 935746577,
"estimated_size": "892.3mb",
"overhead": 1.03
}
}
}
}
Le mardi 11 mars 2014 12:02:12 UTC+1, Lee Hinman a écrit :
Hi Dunaeth,
Can you attach the output of curl 'localhost:9200/_nodes/stats?all', I
would like to compare the current breaker estimation and the actual field
data usage (they should be the same if no field data loading is currently
happening).
;; Lee
--
You received this message because you are subscribed to the Google Groups "elasticsearch" group.
To unsubscribe from this group and stop receiving emails from it, send an email to elasticsearch+unsubscribe@googlegroups.com.
To view this discussion on the web visit https://groups.google.com/d/msgid/elasticsearch/4aca25cd-2903-4f19-8cf9-09820d73017c%40googlegroups.com.
For more options, visit https://groups.google.com/d/optout.