Hello,
I am encountering a "weird" problem with kibana. I am ingesting some few event from an ESXi Vmware through logstash to Elasticsearch.
At first I can see the fields that I added with logstash on the discovery panel like so :

But after a while I don't see them. I figured that it is normal that the discovery won't show you the fields if they were any of them indexed during the specified time range but the weird thing is that when I expand my time range to go back to the previous ones i don't see them :
Like in this screenshot where the field show above named event_name don't show up during a bigger time range :

the same for others like vm_name, event_code, ... etc
Context :
Cluster of 3 nodes: one master-dedicated node and two data nodes HOT/WARM plus one logstash-only node
I am able to query the data with API call and i can see the fields are indexed :
GET vmware/_search?q=event_name:Machine Network VLAN Connected
Gave me this :
{
          "took" : 385,
          "timed_out" : false,
          "_shards" : {
            "total" : 1,
            "successful" : 1,
            "skipped" : 0,
            "failed" : 0
          },
          "hits" : {
            "total" : {
              "value" : 14,
              "relation" : "eq"
            },
            "max_score" : 15.027323,
            "hits" : [
              {
                "_index" : "vmware",
                "_type" : "_doc",
                "_id" : "qNI5PHIBaJTCGwydIlFk",
                "_score" : 15.027323,
                "_source" : {
                  "priority" : 182,
                  "timestamp8601" : "2020-05-22T11:50:39.744Z",
                  "severity" : 6,
                  "message" : """cpu24:3174471)Net: 2456: connected windows-elk eth0 to ELK VLAN, portID 0x3000030
        """,
                  "program" : "vmkernel",
                  "facility" : 22,
                  "timestamp" : "2020-05-22T11:50:39.744Z",
                  "severity_label" : "Informational",
                  "data1" : "cpu24:3174471)",
                  "data2" : """portID 0x3000030
        """,
                  "host" : "@hidden",
                  "vm_name" : "windows-elk",
                  "event_name" : "Machine Network VLAN Connected",
                  "@timestamp" : "2020-05-22T11:50:39.744Z",
                  "@version" : "1",
                  "id" : "2456",
                  "facility_label" : "local6",
                  "vlan_name" : "@hidden",
                  "logsource" : "@hidden",
                  "interface_name" : "eth0"
                }
              },
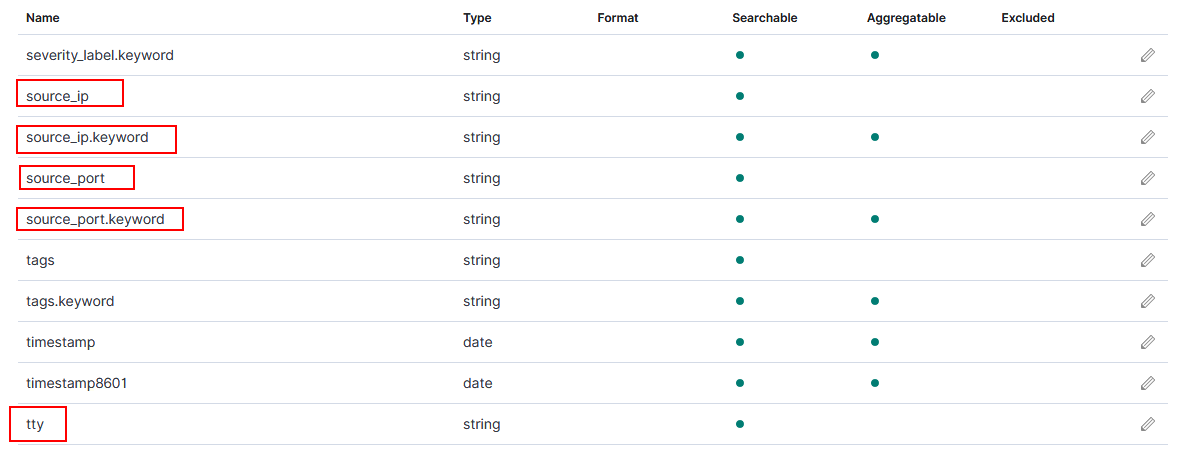
I can also visualize my fields :

The fields are persistent in the index pattern :
My logstash configuration :
input {
  syslog {
    port => 514
  }
}

filter {
        if [message] =~ /verbose/ {
                drop { }
        }
        if "Debug" in [severity_label] {
                drop { }
        }

############################# Hostd ####################################

        else if "Hostd" in [program] and [message] =~ /Event 705/ {
                grok {
                        match => { "message" => "%{GREEDYDATA:data1} Event 705 : User %{DATA:username}@%{IPV4:source_ip} logged in as %{GREEDYDATA:loggedAs}" }
                }
                mutate {
                        add_field => { "event_code" => "705" }
                        add_field => { "event_name" => "Successful Authentication" }
                }
        }
        else if "Hostd" in [program] and [message] =~ /powered off/ {
                grok {
                        match => { "message" => "%{GREEDYDATA:data1} Event %{NUMBER:iddd} : %{DATA:vm_name} on %{GREEDYDATA:logmsg}" }
                }
                mutate {
                       # add_field => { "event_code" => "701" }
                        add_field => { "event_name" => "Machine Powered OFF" }
                }
        }
        else if "Hostd" in [program] and [message] =~ /powered on/ {
                grok {
                        match => { "message" => "%{GREEDYDATA:data1} Event %{NUMBER:iddd} : %{DATA:vm_name} on %{GREEDYDATA:logmsg}" }
                }
                mutate {
                        #add_field => { "event_code" => "711" }
                        add_field => { "event_name" => "Machine Powered ON" }
                }
        }

############################### vmkernel ##############################

        else if "vmkernel" in [program] and [message] =~ /Net: / {
                grok {
                        match => { "message" => "%{GREEDYDATA:data1}Net: %{DATA:id}: connected %{DATA:vm_name} %{DATA:interface_name} %{DATA:vlan_name}, %{GREEDYDATA:data2}"}
                }
                mutate {
                        add_field => { "event_name" => "Machine Network VLAN Connected" }
                }
        }

############################## sshd ##################################

        else if "sshd" in [program] and [message] =~ /Connection from/ {
                grok {
                        match => { "message" => "Connection from %{IPV4:source_ip} port %{NUMBER:source_port}"}
                }
                mutate {
                        add_field => { "event_name" => "Connection Attempt" }
                }
        }
        else if "sshd" in [program] and [message] =~ /Accepted keyboard-interactive/ {
                grok {
                        match => { "message" => "Accepted keyboard-interactive/pam for %{USERNAME:username} from %{IPV4:source_ip} port %{NUMBER:source_port} %{GREEDYDATA:protocol}"}
                }
                mutate {
                        add_field => { "event_name" => "SSH Authentication Success" }
                }
        }
        else if "sshd" in [program] and [message] =~ /Failed keyboard-interactive/ {
                grok {
                        match => { "message" => "Failed keyboard-interactive/pam for invalid user %{USERNAME:username} from %{IPV4:source_ip} port %{NUMBER:source_port} %{GREEDYDATA:protocol}"}
                }
                mutate {
                        add_field => { "event_name" => "SSH Authentication Failure" }
                }
        }
        else if "sshd" in [program] and [message] =~ /pam_unix\(sshd\:auth\)/ {
                grok {
                        match => { "message" => "pam_unix\(sshd\:auth\)\: authentication failure\; logname=%{DATA:logname} uid=%{DATA:uid} euid=%{DATA:euid} tty=%{DATA:tty} ruser=%{DATA:username} rhost=%{IPV4:source_ip}"}
                }
                mutate {
                        add_field => { "event_name" => "SSH Authentication Failure" }
                }
        }
        else if "sshd" in [program] and [message] =~ /pam_unix\(sshd\:session\)/ {
                grok {
                        match => { "message" => "pam_unix\(sshd\:session\)\: session opened for user %{DATA:username} %{GREEDYDATA:data1}"}
                }
                mutate {
                        add_field => { "event_name" => "SSH Session Opened" }
                }
        }
        else if "sshd" in [program] and [message] =~ /Invalid user/ {
                grok {
                        match => { "message" => "Invalid user %{DATA:username} from %{IPV4:source_ip} port %{NUMBER:source_port}"}
                }
                mutate {
                        add_field => { "event_name" => "Invalid Username" }
                }
        }

}

output {
        elasticsearch {
        hosts => ["https://hiddenIP:9200"]
        cacert => "/etc/logstash/ca.pem"
        user => "hidden"
        password => "hidden"
        index => "vmware"
        ssl => true
        ssl_certificate_verification => false
}
}
Even though some events doesn't match my grok I still should get the previous parsed field in Discovery but I don't.
Help please