I'm new in this area.
I am trying to handle the event created by iptables with ELK.
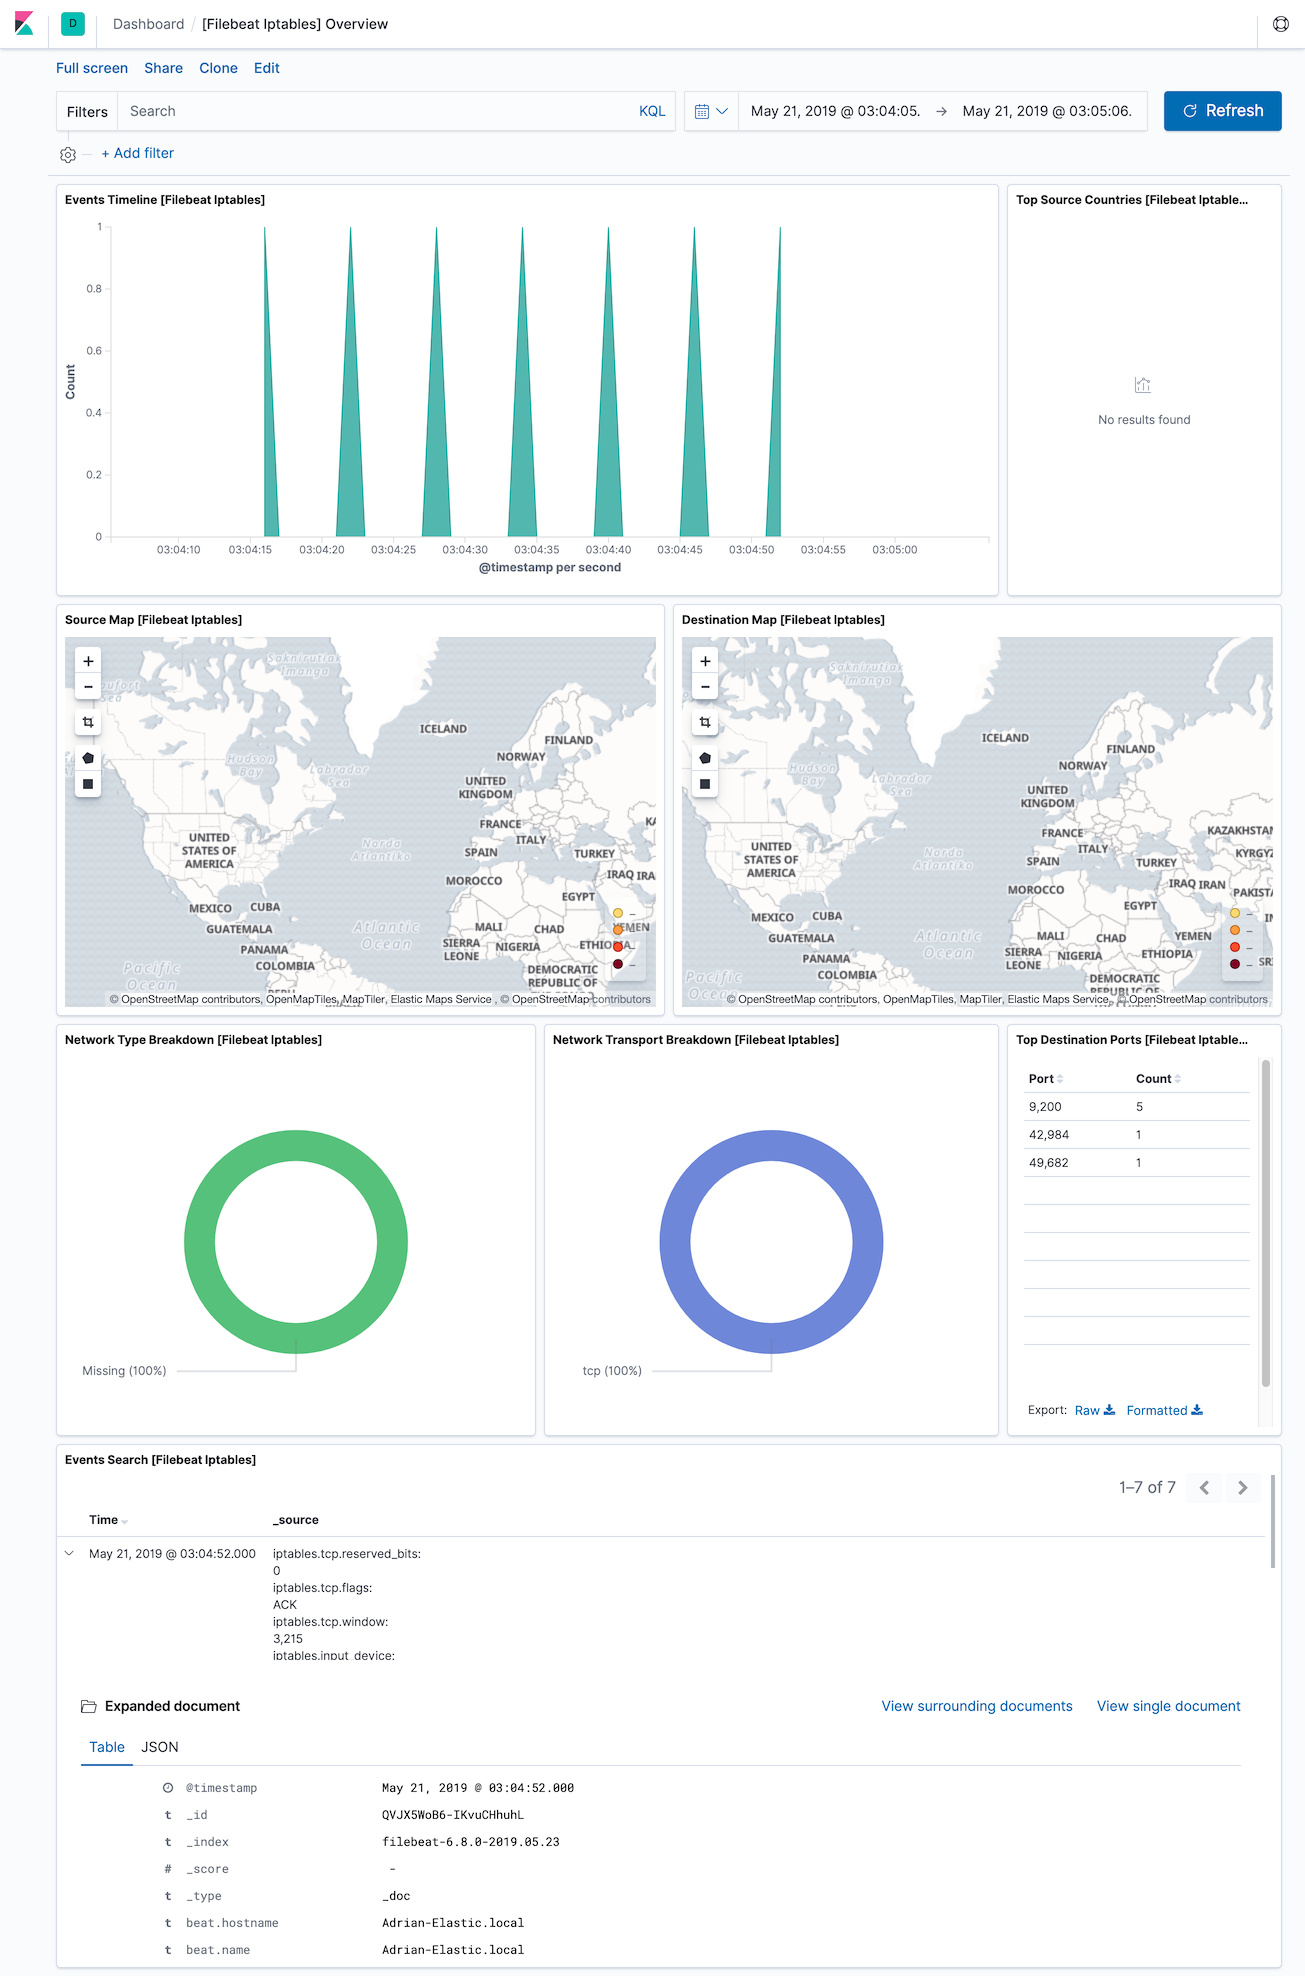
It encountered an error that I could not fix. My Discover have data but Filebeat Iptables Overview report No results found. Here is my configuration.
About Iptables-filter.conf I'm not sure !
Please help me! If there are instructions about iptables-filter.conf please let me know. Thanks!
02-beats-input.conf
input {
beats {
port => 5044
}
}
10-iptables-filter.conf
filter {
if [type] == "iptables" {
grok {
break_on_match => true
match => { "message" => "IPTABLES" }
add_tag => "iptables"
add_tag => "iptables-denied"
add_tag => "iptables-source-geo"
patterns_dir => ["/etc/logstash/grok/iptables.pattern"]
}
# Default 'geoip' == src_ip. That means it's easy to display the DROPPED INPUT
if [src_ip] != "" {
geoip {
source => "src_ip"
add_tag => [ "geoip" ]
target => "src_geoip"
database => "/etc/logstash/GeoLite2-City.mmdb"
}
}
if [dst_ip] != "" {
geoip {
source => "dst_ip"
add_tag => [ "geoip" ]
target => "dst_geoip"
database => "/etc/logstash/GeoLite2-City.mmdb"
}
}
}
date { #use the field timestamp to match event time and #populate@timestamp field (used by Elasticsearch) #match => [ "timestamp", "MMM dd HH:mm:ss","MMM dd HH:mm:ss"]
match => [ "timestamp", "MMM dd YYY HH:mm:ss","MMM d YYY HH:mm:ss","MMM dd HH:mm:ss", "ISO8601" ]
timezone => "Asia/Saigon"
}
}
30-elasticsearch-output.conf
output {stdout { codec => rubydebug }
elasticsearch {
hosts => ["localhost:9200"]
manage_template => false
index => "%{[@metadata][beat]}-%{[@metadata][version]}-%{+YYYY.MM.dd}"
}
}
    # Set which input to use between syslog (default) or file.
    var.input: "file"

    # Set custom paths for the log files. If left empty,
    # Filebeat will choose the paths depending on your OS.
    var.paths: ["/var/log/iptables.log"]
The Filebeat Iptables Overview dashboard works with the fields parsed by the filebeat iptables module. If you are using logstash to parse these log lines the resulting events could be different and not contain the expected fields.
There is no need to use logstash to parse the log lines. You could send the events directly from Filebeat to Elasticsearch, and use the pipeline included in the Filebeat module to parse the log lines. This pipeline also adds the geoip data of the source and destination addresses.
You can read more about using Filebeat modules to parse your data here: https://www.elastic.co/guide/en/beats/filebeat/7.0/filebeat-modules-quickstart.html
Hi @jsoriano.
I feel very happy that you answered my question.
I followed your instructions, it works well with apache2, system modules.
But with iptables I only see data in Discover, my Filebeat iptables Overview is no results found.
I only use ping to test iptables, is that a problem?
In the data of the screenshot there are still tags added by logstash, when you mentioned that you were following my instructions, did you change filebeat configuration with Elasticsearch as output?
In any case you should be able to see something about the iptables.log file. Could you check in the filebeat logs if you see anything about this file?
I have configured Elasticsearch output. My iptables service does not automatically create iptables.log, it just created kern.log. Is the problem in the iptables data file?
I have configured the iptables module /var/log/iptables.log but it has no data. My discover is "No results match your search criteria"
Change iptables.log by kern.log then it starts to have data.
filebeat.yml
#-------------------------- Elasticsearch output ------------------------------
output.elasticsearch:
  # Array of hosts to connect to.
  hosts: ["localhost:9200"]

  # Enabled ilm (beta) to use index lifecycle management instead daily indices.
  #ilm.enabled: false

  # Optional protocol and basic auth credentials.
  #protocol: "https"
  #username: "elastic"
  #password: "changeme"

#----------------------------- Logstash output --------------------------------
#output.logstash:
  # The Logstash hosts
  #hosts: ["localhost:5044"]
I think your problem is that you're looking at a time range that doesn't include any iptables events. Only contains errors because the iptables pipeline tried to parse other logs from your kern.log that are not from iptables.
Change your time range in Kibana's date-picker at the top-right corner.
Also you can filter to only see actual iptables events. Use one of this two options:
In the query bar (>_) type: iptables:*
Below the query bar, click + Add Filter. Select the iptables.id field and exists operator.
If you don't see the iptables fields, go to Index pattern under management and refresh your index pattern.
Hi @adrisr,
I feel very happy that you answered my question.
I followed your instructions,It worked. But I have another problem. Now it won't read file iptables.log. I do not see any new events. I made a mistake somewhere.
/etc/filebeat/modules.d/iptables.yml
- module: iptables
  log:
    enabled: true

    # Set which input to use between syslog (default) or file.
    var.input: "file"

    # Set custom paths for the log files. If left empty,
    # Filebeat will choose the paths depending on your OS.
    var.paths: ["/var/log/iptables.log"]
That must be because Filebeat remembers that the file has already been read. To have it read the file again, you must remove the registry, located at /var/lib/filebeat/registry.
This will cause Filebeat to forget all the data it has already processed, so use with care.
Apache, Apache Lucene, Apache Hadoop, Hadoop, HDFS and the yellow elephant
logo are trademarks of the
Apache Software Foundation
in the United States and/or other countries.