No results found in Kibana sample dashboards for Filebeat

Hello,

I installed ELK 7.2 and Filebeat on the same host running on Debian 9 and I installed only Filebeat on another host running on Centos 7 . I enabled the Filebeat system module on both hosts and Logstash system logs pipelines on the host running ELK as described in https://www.elastic.co/guide/en/logstash/current/logstash-config-for-filebeat-modules.html#parsing-system. I modified the filter for removing the geoip block since I'm using only private IPv4 addresses and in the filter section I used if [event][module] == "system" instead of if [fileset][module] == "system" because when I used the latter, it seemed that messages relevant to authorization logs did not pass the condition and then were not parsed by the grok filter.

After that, I initiated an SSH connection to the two servers and created a new user on the server running on Centos.

However when I load Kibana for visualizing dashboards, most of the dashboards display "No result found". The only visualizations which are displaying results are :

  • Syslog events by hostname [Filebeat System] ECS
  • SSH login attempts [Filebeat System] ECS
  • Successful SSH logins [Filebeat System] ECS

Also on the SIEM UI, the only valuable information displayed is the number of hosts known by ELK. The other dashboards display 0 results.

Do you know how I can fix that to get all the information in the dashboards ?

Thank you in advance

Can you share your actual config files and filebeat log output? Please format configs and logs using the </> button in the editor window.

I didn't modify Elasticsearch and Kibana configuration. Both are listening on the default ports on localhost.

Logstash configuration in /etc/logstash/conf.d/logstash.conf is as below

input {
 beats {
   port => 5044
   ssl => true
   ssl_certificate => "/etc/ssl/elk-server.crt"
   ssl_key => "/etc/ssl/elk-server.key"
  }
}

filter {
  if [event][module] == "system" {
    if [fileset][name] == "auth" {
      grok {
        match => { "message" => ["%{SYSLOGTIMESTAMP:[system][auth][timestamp]} %{SYSLOGHOST:[system][auth][hostname]} sshd(?:\[%{POSINT:[system][auth][pid]}\])?: %{DATA:[system][auth][ssh][event]} %{DATA:[system][auth][ssh][method]} for (invalid user )?%{DATA:[system][auth][user]} from %{IPORHOST:[system][auth][ssh][ip]} port %{NUMBER:[system][auth][ssh][port]} ssh2(: %{GREEDYDATA:[system][auth][ssh][signature]})?",
                  "%{SYSLOGTIMESTAMP:[system][auth][timestamp]} %{SYSLOGHOST:[system][auth][hostname]} sshd(?:\[%{POSINT:[system][auth][pid]}\])?: %{DATA:[system][auth][ssh][event]} user %{DATA:[system][auth][user]} from %{IPORHOST:[system][auth][ssh][ip]}",
                  "%{SYSLOGTIMESTAMP:[system][auth][timestamp]} %{SYSLOGHOST:[system][auth][hostname]} sshd(?:\[%{POSINT:[system][auth][pid]}\])?: Did not receive identification string from %{IPORHOST:[system][auth][ssh][dropped_ip]}",
                  "%{SYSLOGTIMESTAMP:[system][auth][timestamp]} %{SYSLOGHOST:[system][auth][hostname]} sudo(?:\[%{POSINT:[system][auth][pid]}\])?: \s*%{DATA:[system][auth][user]} :( %{DATA:[system][auth][sudo][error]} ;)? TTY=%{DATA:[system][auth][sudo][tty]} ; PWD=%{DATA:[system][auth][sudo][pwd]} ; USER=%{DATA:[system][auth][sudo][user]} ; COMMAND=%{GREEDYDATA:[system][auth][sudo][command]}",
                  "%{SYSLOGTIMESTAMP:[system][auth][timestamp]} %{SYSLOGHOST:[system][auth][hostname]} groupadd(?:\[%{POSINT:[system][auth][pid]}\])?: new group: name=%{DATA:system.auth.groupadd.name}, GID=%{NUMBER:system.auth.groupadd.gid}",
                  "%{SYSLOGTIMESTAMP:[system][auth][timestamp]} %{SYSLOGHOST:[system][auth][hostname]} useradd(?:\[%{POSINT:[system][auth][pid]}\])?: new user: name=%{DATA:[system][auth][useradd][name]}, UID=%{NUMBER:[system][auth][useradd][uid]}, GID=%{NUMBER:[system][auth][useradd][gid]}, home=%{DATA:[system][auth][useradd][home]}, shell=%{DATA:[system][auth][useradd][shell]}$",
                  "%{SYSLOGTIMESTAMP:[system][auth][timestamp]} %{SYSLOGHOST:[system][auth][hostname]} %{DATA:[system][auth][program]}(?:\[%{POSINT:[system][auth][pid]}\])?: %{GREEDYMULTILINE:[system][auth][message]}"] }
        pattern_definitions => {
          "GREEDYMULTILINE"=> "(.|\n)*"
        }
        remove_field => "message"
      }
      date {
        match => [ "[system][auth][timestamp]", "MMM  d HH:mm:ss", "MMM dd HH:mm:ss" ]
      }
    }
    else if [fileset][name] == "syslog" {
      grok {
        match => { "message" => ["%{SYSLOGTIMESTAMP:[system][syslog][timestamp]} %{SYSLOGHOST:[system][syslog][hostname]} %{DATA:[system][syslog][program]}(?:\[%{POSINT:[system][syslog][pid]}\])?: %{GREEDYMULTILINE:[system][syslog][message]}"] }
        pattern_definitions => { "GREEDYMULTILINE" => "(.|\n)*" }
        remove_field => "message"
      }
      date {
        match => [ "[system][syslog][timestamp]", "MMM  d HH:mm:ss", "MMM dd HH:mm:ss" ]
      }
    }
  }
}

output {
  elasticsearch {
    hosts => localhost
    manage_template => false
    index => "%{[@metadata][beat]}-%{[@metadata][version]}-%{+YYYY.MM.dd}"
  }
}

Filebeat is configured in /etc/filebeat/filebeat.yml on both servers as follows

- type: log
  enabled: false
  paths:
    - /var/log/*.log
filebeat.config.modules:
  path: ${path.config}/modules.d/*.yml
  reload.enabled: false
setup.template.settings:
  index.number_of_shards: 1
setup.kibana:
output.logstash:
  hosts: ["elk-server.domain.local:5044"]
  ssl.certificate_authorities: ["/etc/ssl/elk-server.crt"]
processors:
  - add_host_metadata: ~
  - add_cloud_metadata: ~

And when I run the filebeat modules list command on both servers, I get the following output

Enabled:
system

Disabled:
apache
auditd
cisco
coredns
elasticsearch
envoyproxy
haproxy
icinga
iis
iptables
kafka
kibana
logstash
mongodb
mysql
nats
netflow
nginx
osquery
panw
postgresql
rabbitmq
redis
santa
suricata
traefik
zeek

Here is an output of Filebeat log file /var/log/filebeat on the ELK server running on Debian 9

Jul 09 10:25:26 elk-server filebeat[1067]: 2019-07-09T10:25:26.880+0200        INFO        [monitoring]        log/log.go:145        Non-zero metrics in the last 30s        {"monitoring": {"metrics": {"beat":{"cpu":{"system":{"ticks":82660,"time":{"ms":32}},"total":{"ticks":406760,"time":{"ms":56},"value":406760},"user":{"ticks":324100,"time":{"ms":24}}},"handles":{"limit":{"hard":4096,"soft":1024},"open":8},"info":{"ephemeral_id":"b0efeb20-37e7-48ae-8f00-d94f245cc446","uptime":{"ms":323070109}},"memstats":{"gc_next":7002144,"memory_alloc":3630792,"memory_total":28479398600},"runtime":{"goroutines":47}},"filebeat":{"events":{"added":2,"done":2},"harvester":{"open_files":2,"running":2}},"libbeat":{"config":{"module":{"running":0}},"output":{"events":{"acked":2,"batches":2,"total":2},"read":{"bytes":70},"write":{"bytes":2164}},"pipeline":{"clients":4,"events":{"active":0,"published":2,"total":2},"queue":{"acked":2}}},"registrar":{"states":{"current":6,"update":2},"writes":{"success":2,"total":2}},"system":{"load":{"1":0.12,"15":0.15,"5":0.21,"norm":{"1":0.12,"15":0.15,"5":0.21}}}}}}
Jul 09 10:25:56 elk-server filebeat[1067]: 2019-07-09T10:25:56.872+0200        INFO        [monitoring]        log/log.go:145        Non-zero metrics in the last 30s        {"monitoring": {"metrics": {"beat":{"cpu":{"system":{"ticks":82680,"time":{"ms":20}},"total":{"ticks":406800,"time":{"ms":40},"value":406800},"user":{"ticks":324120,"time":{"ms":20}}},"handles":{"limit":{"hard":4096,"soft":1024},"open":8},"info":{"ephemeral_id":"b0efeb20-37e7-48ae-8f00-d94f245cc446","uptime":{"ms":323100110}},"memstats":{"gc_next":7002912,"memory_alloc":3759168,"memory_total":28481528360},"runtime":{"goroutines":47}},"filebeat":{"events":{"added":1,"done":1},"harvester":{"open_files":2,"running":2}},"libbeat":{"config":{"module":{"running":0}},"output":{"events":{"acked":1,"batches":1,"total":1},"read":{"bytes":70},"write":{"bytes":1092}},"pipeline":{"clients":4,"events":{"active":0,"published":1,"total":1},"queue":{"acked":1}}},"registrar":{"states":{"current":6,"update":1},"writes":{"success":1,"total":1}},"system":{"load":{"1":0.07,"15":0.15,"5":0.19,"norm":{"1":0.07,"15":0.15,"5":0.19}}}}}}
Jul 09 10:26:26 elk-server filebeat[1067]: 2019-07-09T10:26:26.875+0200        INFO        [monitoring]        log/log.go:145        Non-zero metrics in the last 30s        {"monitoring": {"metrics": {"beat":{"cpu":{"system":{"ticks":82680},"total":{"ticks":406830,"time":{"ms":32},"value":406830},"user":{"ticks":324150,"time":{"ms":32}}},"handles":{"limit":{"hard":4096,"soft":1024},"open":8},"info":{"ephemeral_id":"b0efeb20-37e7-48ae-8f00-d94f245cc446","uptime":{"ms":323130109}},"memstats":{"gc_next":7006016,"memory_alloc":5215696,"memory_total":28485038720},"runtime":{"goroutines":47}},"filebeat":{"events":{"added":2,"done":2},"harvester":{"open_files":2,"running":2}},"libbeat":{"config":{"module":{"running":0}},"output":{"events":{"acked":2,"batches":2,"total":2},"read":{"bytes":70},"write":{"bytes":2158}},"pipeline":{"clients":4,"events":{"active":0,"published":2,"total":2},"queue":{"acked":2}}},"registrar":{"states":{"current":6,"update":2},"writes":{"success":2,"total":2}},"system":{"load":{"1":0.04,"15":0.14,"5":0.17,"norm":{"1":0.04,"15":0.14,"5":0.17}}}}}}
Jul 09 10:26:56 elk-server filebeat[1067]: 2019-07-09T10:26:56.875+0200        INFO        [monitoring]        log/log.go:145        Non-zero metrics in the last 30s        {"monitoring": {"metrics": {"beat":{"cpu":{"system":{"ticks":82700,"time":{"ms":16}},"total":{"ticks":406870,"time":{"ms":40},"value":406870},"user":{"ticks":324170,"time":{"ms":24}}},"handles":{"limit":{"hard":4096,"soft":1024},"open":8},"info":{"ephemeral_id":"b0efeb20-37e7-48ae-8f00-d94f245cc446","uptime":{"ms":323160110}},"memstats":{"gc_next":4381280,"memory_alloc":4032112,"memory_total":28487174528},"runtime":{"goroutines":47}},"filebeat":{"events":{"added":1,"done":1},"harvester":{"open_files":2,"running":2}},"libbeat":{"config":{"module":{"running":0}},"output":{"events":{"acked":1,"batches":1,"total":1},"read":{"bytes":35},"write":{"bytes":1095}},"pipeline":{"clients":4,"events":{"active":0,"published":1,"total":1},"queue":{"acked":1}}},"registrar":{"states":{"current":6,"update":1},"writes":{"success":1,"total":1}},"system":{"load":{"1":0.02,"15":0.14,"5":0.15,"norm":{"1":0.02,"15":0.14,"5":0.15}}}}}}

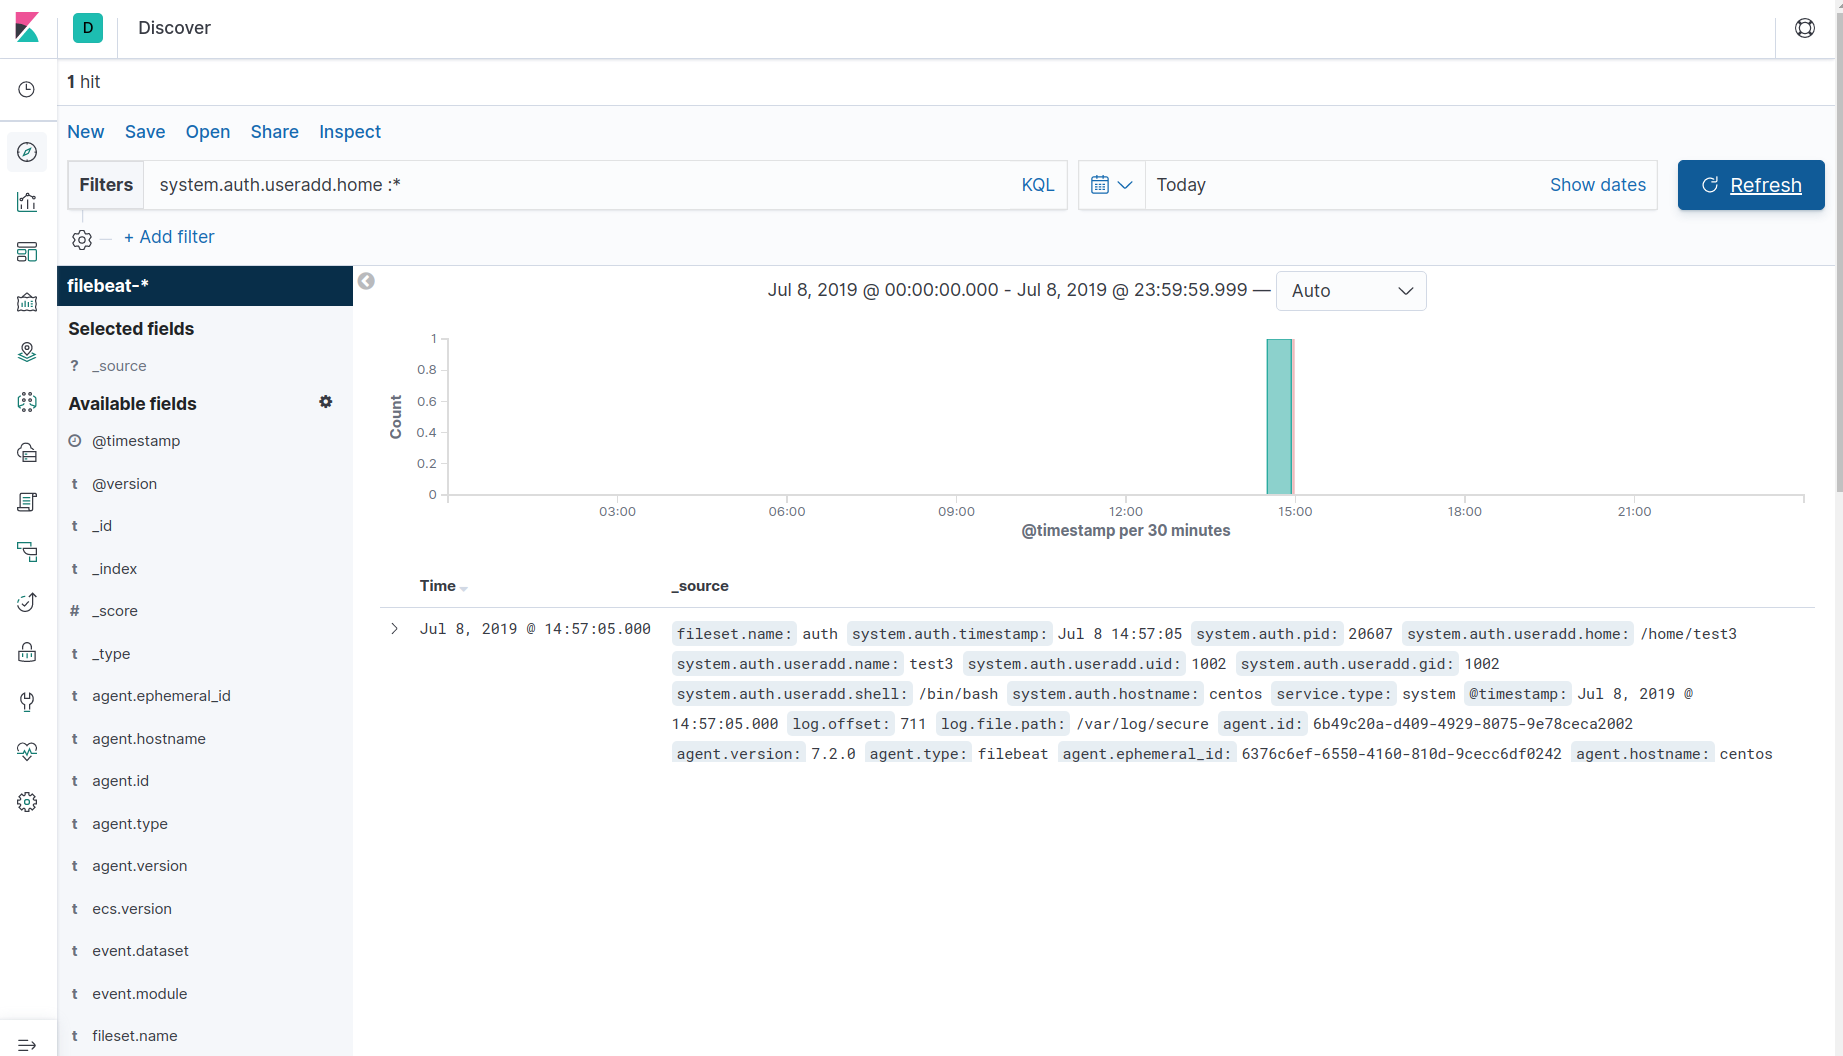
And an output of the same log file on the server running on Centos 7

Jul 09 10:28:37 centos filebeat[3544]: 2019-07-09T10:28:37.541-0400        INFO        [monitoring]        log/log.go:145        Non-zero metrics in the last 30s        {"monitoring": {"metrics": {"beat":{"cpu":{"system":{"ticks":236970,"time":{"ms":10}},"total":{"ticks":551420,"time":{"ms":52},"value":551420},"user":{"ticks":314450,"time":{"ms":42}}},"handles":{"limit":{"hard":4096,"soft":1024},"open":7},"info":{"ephemeral_id":"6376c6ef-6550-4160-810d-9cecc6df0242","uptime":{"ms":320040044}},"memstats":{"gc_next":6901888,"memory_alloc":3607000,"memory_total":40919681920},"runtime":{"goroutines":42}},"filebeat":{"events":{"added":12,"done":12},"harvester":{"open_files":1,"running":1}},"libbeat":{"config":{"module":{"running":0}},"output":{"events":{"acked":12,"batches":2,"total":12},"read":{"bytes":70},"write":{"bytes":2547}},"pipeline":{"clients":4,"events":{"active":0,"published":12,"total":12},"queue":{"acked":12}}},"registrar":{"states":{"current":6,"update":12},"writes":{"success":2,"total":2}},"system":{"load":{"1":0,"15":0.05,"5":0.01,"norm":{"1":0,"15":0.05,"5":0.01}}}}}}
Jul 09 10:29:07 centos filebeat[3544]: 2019-07-09T10:29:07.559-0400        INFO        [monitoring]        log/log.go:145        Non-zero metrics in the last 30s        {"monitoring": {"metrics": {"beat":{"cpu":{"system":{"ticks":237010,"time":{"ms":37}},"total":{"ticks":551470,"time":{"ms":51},"value":551470},"user":{"ticks":314460,"time":{"ms":14}}},"handles":{"limit":{"hard":4096,"soft":1024},"open":7},"info":{"ephemeral_id":"6376c6ef-6550-4160-810d-9cecc6df0242","uptime":{"ms":320070045}},"memstats":{"gc_next":4321264,"memory_alloc":3901472,"memory_total":40923355536},"runtime":{"goroutines":42}},"filebeat":{"events":{"added":12,"done":12},"harvester":{"open_files":1,"running":1}},"libbeat":{"config":{"module":{"running":0}},"output":{"events":{"acked":12,"batches":2,"total":12},"read":{"bytes":70},"write":{"bytes":2554}},"pipeline":{"clients":4,"events":{"active":0,"published":12,"total":12},"queue":{"acked":12}}},"registrar":{"states":{"current":6,"update":12},"writes":{"success":2,"total":2}},"system":{"load":{"1":0,"15":0.05,"5":0.01,"norm":{"1":0,"15":0.05,"5":0.01}}}}}}

I don't see any error in the logs.

I presume you have written the logstash filters yourself, based on the original modules? Can you try without Logstash, but via Ingest node? I wonder if there is some difference between the events.

Regarding the Logstash filter, compared to the one defined on https://www.elastic.co/guide/en/logstash/current/logstash-config-for-filebeat-modules.html#parsing-system, I just replaced [fileset][module] by [event][module] and I deleted the geoip block. The rest of the filter remains untouched.

I will give a try with ingest node without Logstash. I am looking for ingest node definitions for parsing system logs but I cannot see any example related to that on https://www.elastic.co. Could you please tell me how I can write these definitions ?

Filebeat modules are written to use Elasticsearch Ingest Node, out of the box. You are not supposed to write your own definition.

Thank you, I used the following guide https://www.elastic.co/guide/en/logstash/current/use-ingest-pipelines.html for loading Filebeat ingest pipelines for the system module into Elasticsearch and I completely modified Logstash configuration as described in the guide. The dashboards are now displaying well in Kibana

This topic was automatically closed 28 days after the last reply. New replies are no longer allowed.