Filebeat logs with .txt extension -- no geoip.location or geoip_point

Filebeat logs with .log somewhere in the extensions works fine, but will not present the IP address if the extension is .txt I have not been able to find how to resolve this opportunity on the web.
Thanks for the help in advance.

logstash conf file, logstash.yml, filebeat.yml followed by screenshot examples.

My logstash stdapache.conf

input { stdin {} }
filter {
grok { match => { "message" => "%{COMBINEDAPACHELOG}" } }
geoip { source => "clientip" }
}
output {
elasticsearch {
hosts => "localhost:9200"
manage_template => false
index => "%{[@metadata][beat]}-%{+YYYY.MM.dd}"
document_type => "%{[@metadata][type]}"
}
}

Logstash.yml with # comments not copied.

path.data: /var/lib/logstash
path.config: /etc/logstash/conf.d
path.logs: /var/log/logstash

filebeat.yml with # comments not copied.

filebeat.prospectors:
- /var/log/tomcat8/localhost_access_log.*.txt
- /var/log/nginx/access.log.1
- /var/log/nginx/error.log.1
output.logstash:
hosts: ["192.168.5.66:5044"]

Example1 showing Ip addresses which were resolved from .log messages. the unresolved ip addresses were from messages without an ip address or a .txt message which had an ip address.

Example2 through X from messages with .log in their extension.


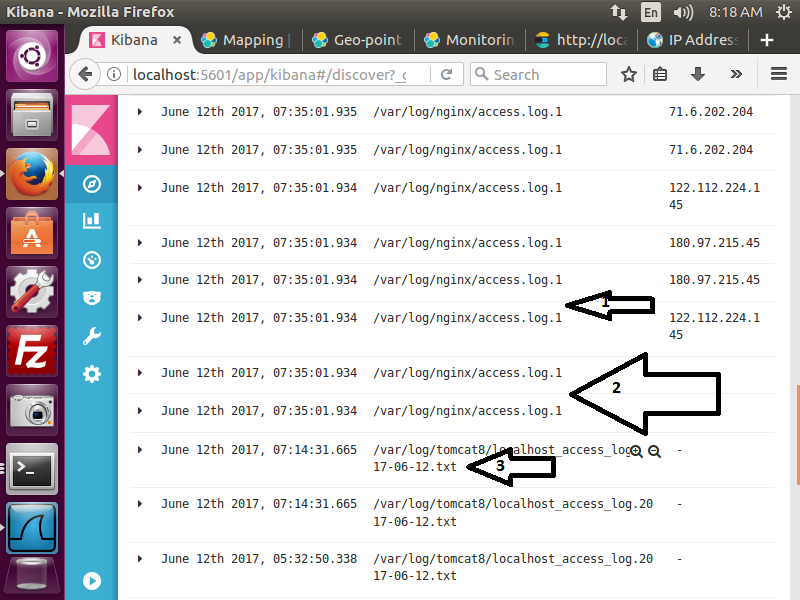
Example 3 arrow 1 has geoip.location arrow 2 shows thw message with ip address

Example4

Example5 from .log message without an ip address.

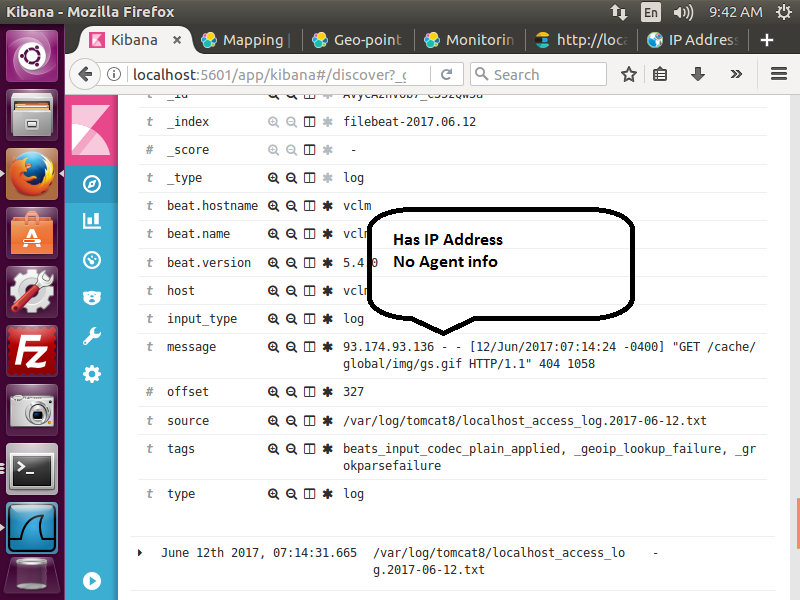
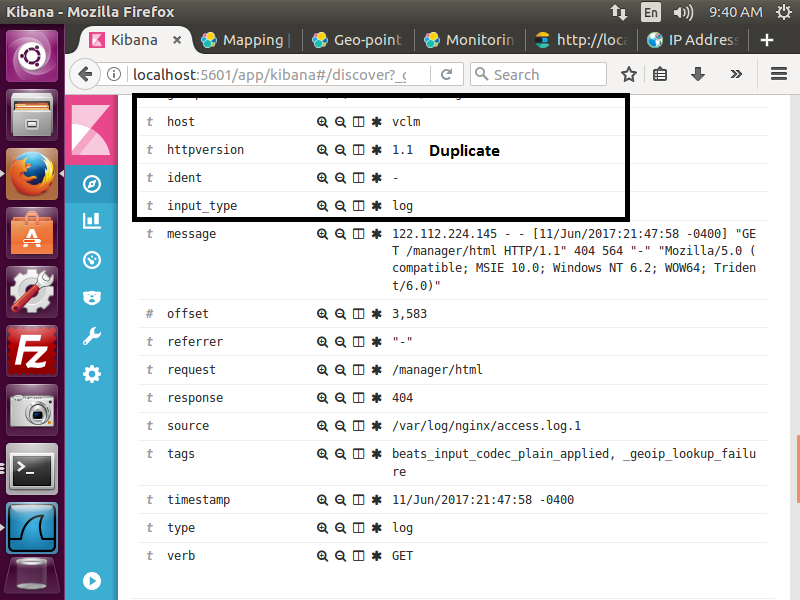
Example6 & 7 from .txt extension log has an ip address.

Example7 has an ip address, but no agent info also no ip address is resolved to display any geoip info


How did you come to the conclusion that it's the file extension?

My guess is that the format of the nginx access logs and the Tomcat access logs is slightly different. Try using the grok debugger on one of your nginx log lines and on one of your tomcat log lines. Use the pattern from your config -- %{COMBINEDAPACHELOG}, and see what fields are parsed and see if there is a difference.

My LOogs:

The /var/log/tomcat8/localhost_access_log.2017-06-14.txt Logs failed -no match
91.236.75.4 - - [14/Jun/2017:08:08:25 -0400] "GET / HTTP/1.1" 200 1896

changed the log to 91.236.75.4 - - [14/Jun/2017:08:08:25 -0400] "GET / HTTP/1.1" 200 1896 "-" "-" & received a client.ip 91.236.75.4 plus much more info.

The /var/log/nginx/access.log.1 Logs worked in grok debugger - no modification - worked .
91.230.47.3 - - [13/Jun/2017:15:22:39 -0400] "GET / HTTP/1.0" 200 612 "-" "-"
179.185.199.236 - - [13/Jun/2017:16:47:44 -0400] "GET / HTTP/1.1" 200 612 "-" "curl/7.17.1 (mips-unknown-linux-gnu) libcurl/7.17.1

What should I change & how to make the change?

Bad case of normality bias. After playing around with grok debugger I found %{COMMONAPACHELOG} which worked.

I had a client.ip , but it drops information in the nginx log:
"QUOTEDSTRING": [
[
""-"",
""curl/7.17.1 (mips-unknown-linux-gnu) libcurl/7.17.1 OpenSSL/0.9.8i zlib/1.2.3""
]
],
"agent": [
[
""curl/7.17.1 (mips-unknown-linux-gnu) libcurl/7.17.1 OpenSSL/0.9.8i zlib/1.2.3""
]

So did you get it working?

Another option would be to define more than one grok filter in your Logstash config. You could apply one pattern to the nginx logs and other to the tomcat logs.

Sorry, I am a script kiddie - how would I define the grok filters?

Before going down that route, can you post two JSON events from Kibana. The screenshots don't show the complete event. Please copy the JSON source from a nginx event and a tomcat event. Use the JSON tab as shown in the screenshot to display the raw JSON.

I'm requesting this because grok seems to be working for me on the two log samples you provided.

"source": "/var/log/nginx/access.log.1",

{
  "_index": "filebeat-2017.06.15",
  "_type": "log",
  "_id": "AVyriSgpob7_c35zQyOG",
  "_version": 1,
  "_score": null,
  "_source": {
    "request": "/",
    "agent": "\"-\"",
    "geoip": {
      "ip": "91.230.47.3",
      "latitude": 55.7386,
      "country_code2": "RU",
      "country_name": "Russia",
      "continent_code": "EU",
      "country_code3": "RU",
      "location": [
        37.6068,
        55.7386
      ],
      "longitude": 37.6068
    },
    "offset": 3432,
    "auth": "-",
    "ident": "-",
    "input_type": "log",
    "verb": "GET",
    "source": "/var/log/nginx/access.log.1",
    "message": "91.230.47.3 - - [15/Jun/2017:01:54:48 -0400] \"GET / HTTP/1.0\" 200 612 \"-\" \"-\"",
    "type": "log",
    "tags": [
      "beats_input_codec_plain_applied",
        "_geoip_lookup_failure"
    ],
    "referrer": "\"-\"",
    "@timestamp": "2017-06-15T11:35:08.826Z",
    "response": "200",
    "bytes": "612",
    "clientip": "91.230.47.3",
    "@version": "1",
    "beat": {
      "hostname": "vclm",
      "name": "vclm",
      "version": "5.4.0"
    },
    "host": "vclm",
    "httpversion": "1.0",
    "timestamp": "15/Jun/2017:01:54:48 -0400"
  },
  "fields": {
    "@timestamp": [
      1497526508826
    ]
  },
  "sort": [
    1497526508826
  ]
}

"source": "/var/log/tomcat8/localhost_access_log.2017-06-15.txt",

{
  "_index": "filebeat-2017.06.15",
  "_type": "log",
  "_id": "AVyqxHV4ob7_c35zQyL0",
  "_version": 1,
  "_score": null,
  "_source": {
    "@timestamp": "2017-06-15T08:00:15.925Z",
    "geoip": {},
    "offset": 163,
    "@version": "1",
    "input_type": "log",
    "beat": {
      "hostname": "vclm",
      "name": "vclm",
      "version": "5.4.0"
    },
    "host": "vclm",
    "source": "/var/log/tomcat8/localhost_access_log.2017-06-15.txt",
    "message": "127.0.0.1 - - [15/Jun/2017:04:00:04 -0400] \"GET /guacamole/ HTTP/1.1\" 200 4310",
    "type": "log",
    "tags": [
      "beats_input_codec_plain_applied",
      "_geoip_lookup_failure",
      "_grokparsefailure"
    ]
  },
  "fields": {
    "@timestamp": [
      1497513615925
    ]
 },
  "sort": [
    1497513615925
  ]
}

You need to make an adjustment to your grok filter since the tomcat access logs do not seem to include the %{QS:referrer} %{QS:agent} parts. I tested with this and it appears to work.

input {
  generator {
    lines => [
      '127.0.0.1 - - [15/Jun/2017:04:00:04 -0400] "GET /guacamole/ HTTP/1.1" 200 4310',
      '91.230.47.3 - - [15/Jun/2017:01:54:48 -0400] "GET / HTTP/1.0" 200 612 "-" "-"'
    ]
    count => 1
  }
}

filter {
  grok {
    match => {
      "message" => [
        "%{COMBINEDAPACHELOG}",
        "%{COMMONAPACHELOG}"
      ]
    }
  }
  geoip { source => "clientip" }
}

output {
  stdout { codec => rubydebug { metadata => true } }
}

The previous /var/log/tomcat8/.....txt log was a bad example, a 127.0.0.1(localhost) address. here is one with a good ip address - 168.1.128.38.
Continent: North America
Country: United States us flag
Latitude: 37.751 (37° 45′ 3.60″ N)
Longitude: -97.822 (97° 49′ 19.20″ W)

"source": "/var/log/tomcat8/localhost_access_log.2017-06-15.txt",
{
"_index": "filebeat-2017.06.15",
"_type": "log",
"_id": "AVyraIAzob7_c35zQyN2",
"_version": 1,
"_score": null,
"_source": {
"@timestamp": "2017-06-15T10:59:28.345Z",
"geoip": {},
"offset": 235,
"@version": "1",
"input_type": "log",
"beat": {
"hostname": "vclm",
"name": "vclm",
"version": "5.4.0"
},
"host": "vclm",
"source": "/var/log/tomcat8/localhost_access_log.2017-06-15.txt",
"message": "168.1.128.38 - - [15/Jun/2017:06:59:14 -0400] "GET / HTTP/1.0" 200 1896",
"type": "log",
"tags": [
"beats_input_codec_plain_applied",
"_geoip_lookup_failure",
"_grokparsefailure"
]
},
"fields": {
"@timestamp": [
1497524368345
]
},
"sort": [
1497524368345
]

As you suggested, I changed my grok statement to:

BINGO!! ALL IS WELL!!
THANKS!!!!!!!!

This topic was automatically closed 28 days after the last reply. New replies are no longer allowed.