Filebeat output to logstash

So am using filebeat to fetch 3 types of logs from websphere

  paths:
       - /opt/IBM/HTTPServer/logs/access_log
      document_type: access_log
    -
      paths:
        - /opt/IBM/WebSphere/AppServer/profiles/WPS00/logs/DEV00WPS*/SystemOut.log
        - /opt/IBM/WebSphere/AppServer/profiles/DMGRDEV/logs/dmgr/SystemOut.log
      document_type: BPM
    -
      paths:
        - /var/log/messages
        - /var/log/secure
      document_type: syslog

and in logstash config i have grok filter for proper formatting of these logs

    filter {
    		if "access_logs" in [tags] 
    		{
    		grok {
    			match => {
    						"message" => "%{IPORHOST:x_forwarded_for} - - \[%{HTTPDATE:timestamp}\] "(?:%{WORD:verb} %{NOTSPACE:request} HTTP/%{NUMBER:httpversion})" %{NUMBER:response}"
    					}
    			}
    		}
		    if "BPM" in [tags] 
    		{
    		grok {
    			match => {
    						"message" => "%{SYSLOG5424SD:BPM_timestamp} %{BASE16NUM:ThreadID} %{WORD:EventType} %{WORD:ShortName}   %{WORD:MessageIdentifier}:%{SPACE}%{GREEDYDATA:event}"
    					}
    			}
    		}
		    if "syslog" in [tags]
    		{
    		grok {
    			match => {
    						"message" => "%{SYSLOGTIMESTAMP:syslog_timestamp} %{SYSLOGHOST:syslog_hostname} %{DATA:syslog_program} (?:\[%{POSINT:syslog_pid}\])?%{GREEDYDATA:syslog_message}"
    					}
    			}
    		}
    	}

am so confused as how the output part should be for this config.

the document_type will be accesible as field [type] in logstash. If you want to use tags, use the tags option in filebeat.

I did , and my output part looks like this, but this is not able to create the indices in logstash.
I dont know how else to construct output part.

if [tags] == "access_log"
{
	output {
	elasticsearch { 
					hosts => ["10.190.188.174:9200"]
					index => "access-%{+YYYY.MM.dd}"
				}
			}
	}
else if [tags] == "BPM"
{
	output {
	elasticsearch { 
					hosts => ["10.190.188.174:9200"]
					index => "bpm-%{+YYYY.MM.dd}"
				}
		}
}

well, I'm no expert in logstash, but shouldn't it be

output {
    if [tags] == "access_log" {
	    elasticsearch { 
					hosts => ["10.190.188.174:9200"]
					index => "access-%{+YYYY.MM.dd}"
				}
		}	
	} else if [tags] == "BPM" {
	    elasticsearch { 
					hosts => ["10.190.188.174:9200"]
					index => "bpm-%{+YYYY.MM.dd}"
	    }
	}
}

Yes correct i have made that change, now the indices "Access" and "bpm" are not being created in elasticsearch.
Should i have these in filebeat.yml config?

Seems like a simple error to me . Try this.

output {
if [tags] == "access_log" {
elasticsearch {
hosts => ["10.190.188.174:9200"]
index => "access-%{+YYYY.MM.dd}"
}
}
else if [tags] == "BPM" {
elasticsearch {
hosts => ["10.190.188.174:9200"]
index => "bpm-%{+YYYY.MM.dd}"
}
}
}

Thanks,
Now am able to separate the logs, but the documents are being duplicated 4 times for each log.
This never happened before.

Is it just the old logs or all logs? Could it be that you sent the log files multiple times because you removed the registry?

All logs including the one's populating today,
I didn't get you there "removed registry" ??
I don't remember doing that.

Filebeat has a registry file to keep the state. Could it be that you remove this one?

No, registry file is present in var/lib/filebeat/

Still for every id in the index i could see 4 duplicate entries!

Could you try to write the events to file on the filebeat side and see if there are also duplicates? If not, there is probably something going on on the LS side as part of your script. Check also your filebeat logs of there are some errors inside related to sending.

How the DB logs are accessed in this way? Am using JDBC plugin to fetch DB logs as well.

I checked writing the output of filebeat to file it is writing only once.
I couldn't find filebeat log file.

As you have it in the file only once, I think either something during the transmission is going wrong, LS script has some issues. You could try to enable debug output in LS to see if it appears there twice.

How did you install filebeat? You could also check in your config file where the log file should be.

Ya i enabled "stdout { codec => rubydebug}" but there is no duplication.
No discrepancy in FIlebeat logs as well. Am running filebeat 1.3.1 is updating necessary?

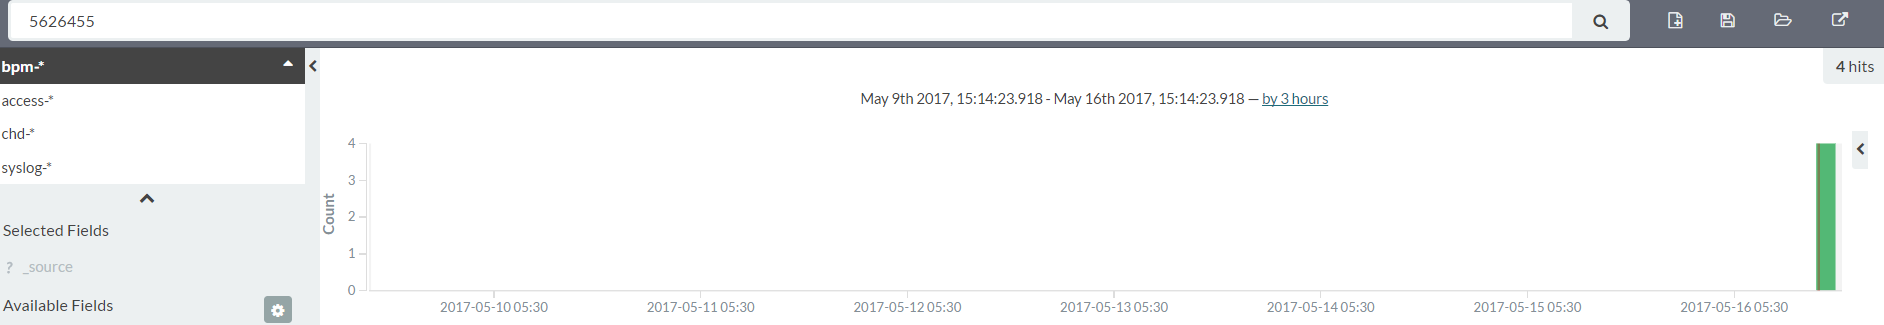
This is my logstash.conf file i have used conditionals to differentiate the events.


input {
      beats {
        port => 5044
                    }
            }

filter {
  if "access_logs" in [tags] {
    grok {
      match => {
        "message" => [
          "%{IPORHOST:x_forwarded_for} %{IPORHOST:load_balancer} %{USER:ident} %{USER:auth} \[%{HTTPDATE:timestamp}\] \"(?:%{WORD:verb}%{SPACE} \/%{WORD:application}%{NOTSPACE:request}(?: HTTP/%{NUMBER:httpversion})?|%{DATA:rawrequest})\" %{NUMBER:response} (?:%{NUMBER:bytes}|-) (?:%{WORD:ServerHost}:%{WORD:ServerPort})",
          "%{IPORHOST:clientip} %{USER:ident} %{USER:auth} \[%{HTTPDATE:timestamp}\] \"(?:%{WORD:verb} \/%{WORD:application}%{NOTSPACE:request}(?: HTTP/%{NUMBER:httpversion})?|%{DATA:rawrequest})\" %{NUMBER:response} (?:%{NUMBER:bytes}|-) (?:%{WORD:ServerHost}:%{WORD:ServerPort})",
          "%{IPORHOST:clientip} %{USER:ident} %{USER:auth} \[%{HTTPDATE:timestamp}\] \"(?:%{WORD:verb} \/%{WORD:application}%{NOTSPACE:request}(?: HTTP/%{NUMBER:httpversion})?|%{DATA:rawrequest})\" %{NUMBER:response} (?:%{NUMBER:bytes}|-)"
        ]
      }
    }
  }
  if "BPM" in [tags] {
    grok {
      match => {
        "message" => [
          "%{SYSLOG5424SD}%{SPACE}%{BASE16NUM:ThreadID}%{SPACE}%{WORD:ShortName}%{SPACE}%{WORD:EventType}%{SPACE}%{WORD:MessageIdentifier}:%{SPACE}%{GREEDYDATA:event}",
          "%{SYSLOG5424SD}%{SPACE}%{WORD:ThreadID}%{SPACE}%{WORD:Logger}%{SPACE}%{WORD:MessageType}%{SPACE}%{GREEDYDATA:event}"
        ]
      }
    }
  }
  if "syslog" in [tags] {
    grok {
      match => {
        "message" => [
          "%{SYSLOGTIMESTAMP:syslog_timestamp} %{SYSLOGHOST:syslog_hostname} %{DATA:syslog_program}(?:\[%{POSINT:syslog_pid}\])?: %{GREEDYDATA:syslog_message}"
        ]
      }
    }
  }
}

output {
stdout { codec => rubydebug}
 if [type] == "access_log" {
elasticsearch { 
hosts => ["10.190.188.174:9200"]
index => "access-%{+YYYY.MM.dd}"
         }
	}	
else if [type] == "BPM" {
  elasticsearch { 
hosts => ["10.190.188.174:9200"]
index => "bpm-%{+YYYY.MM.dd}"
  }
}
else if [type] == "syslog" {
elasticsearch {
hosts => ["10.190.188.174:9200"]
 index => "syslog-%{+YYYY.MM.dd}"
}
}
#else if [type] == "JDBC" {
#elasticsearch {
#hosts => ["10.190.188.174:9200"]
#index => "chd-%{+YYYY.MM.dd}"
#}
#}
}

It will definitively not hurt to update to the most recent release of filebeat and if possible also the rest of the stack. Duplicates can happen if you have network issues but in general I would expect this to be an edge case.

Could you try to wipe your complete setup and try it again with the most recent version and see if it still happens.?

1 Like

This topic was automatically closed 28 days after the last reply. New replies are no longer allowed.